
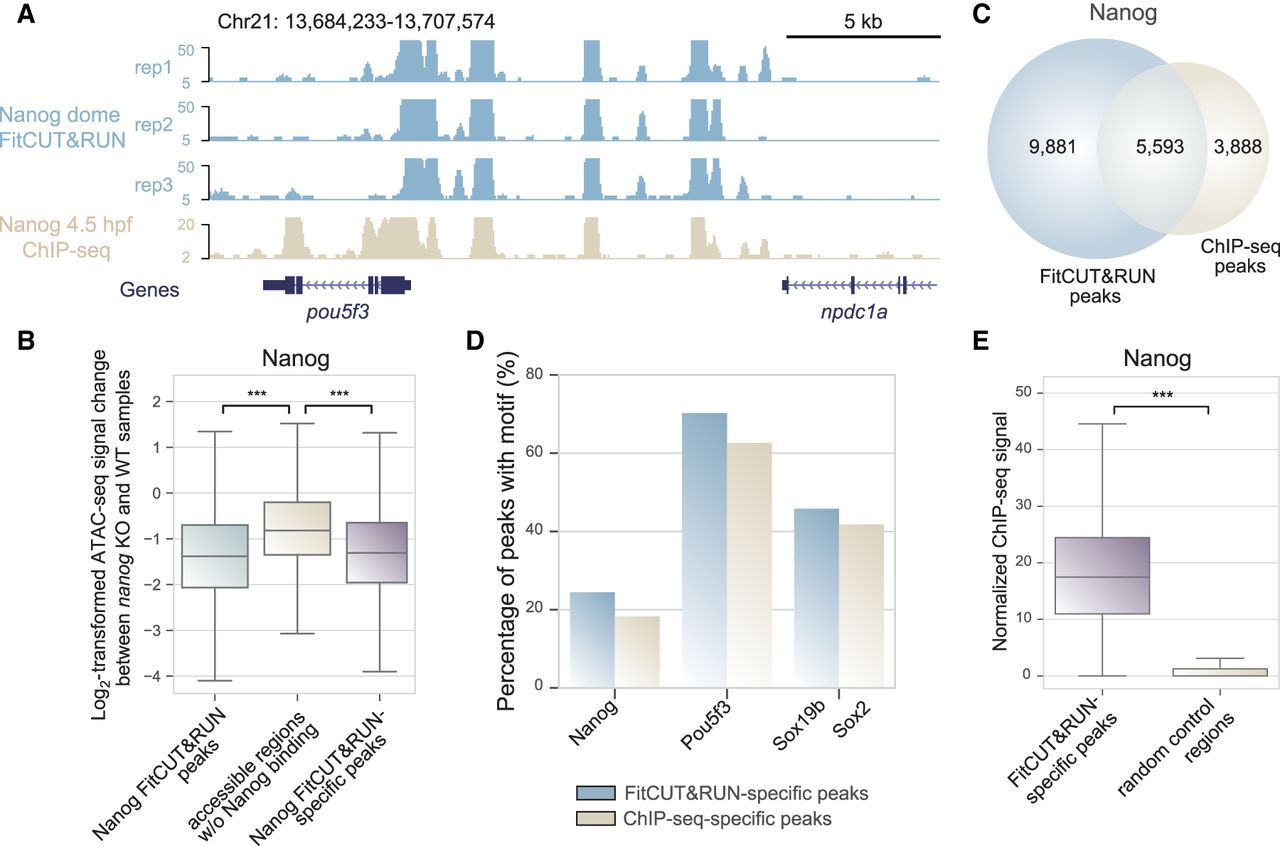
Reliable quality data obtained using the FitCUT&RUN method with early zebrafish embryos. (A) The genome browser view shows Nanog FitCUT&RUN (three replicates) and ChIP-seq (one replicate) signals around pou5f3 loci as a representative example of the consistency between these two methods. (B) Box plots showing the ATAC-seq signal (oblong stage) change between nanog-KO and wild-type samples (Supplemental Table S3; Pálfy et al. 2020) in three different regions. A significant decrease in Nanog FitCUT&RUN peaks compared to those of accessible regions (oblong stage) (Supplemental Table S3; Liu et al. 2018) without overlap with Nanog FitCUT&RUN peaks indicates that Nanog is critical for the establishment of accessible chromatin in these Nanog FitCUT&RUN peaks. A significant decrease in Nanog FitCUT&RUN-specific peaks compared to those of accessible regions (oblong stage) (Supplemental Table S3; Liu et al. 2018) without overlap with Nanog FitCUT&RUN peaks shows the reliability of the FitCUT&RUN-specific peak data, indicating that FitCUT&RUN can produce reliable TF occupancy profiles during zebrafish ZGA. (C) Venn diagram showing the overlap status between Nanog FitCUT&RUN and ChIP-seq data. The majority of ChIP-seq peaks were also detected by FitCUT&RUN; and FitCUT&RUN could detect many more peaks than ChIP-seq (Supplemental Table S4). (D) Bar plots showing the higher motif frequency of Nanog, Pou5f3, and Sox19b in the FitCUT&RUN-specific peaks compared to that in the ChIP-seq-specific peaks, indicating the reliability of the FitCUT&RUN data (Supplemental Table S4). (E) Box plots showing that the normalized Nanog ChIP-seq signal on FitCUT&RUN-specific peaks is significantly greater than that on random control regions, confirming the reliability of the Nanog FitCUT&RUN data.


