
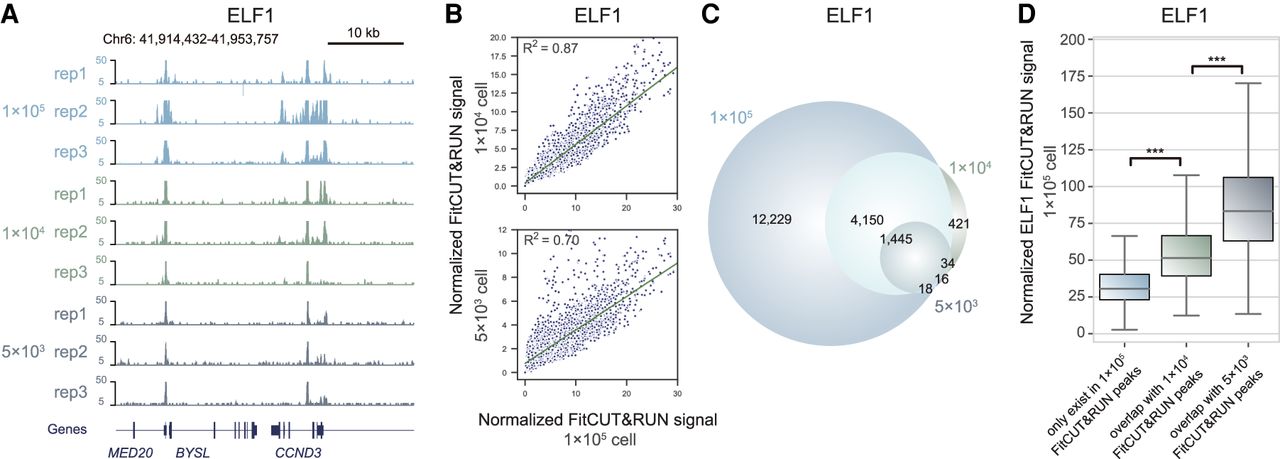
Robustness of FitCUT&RUN with reduced input material in K562 cells. (A) The genome browser view shows the ELF1 FitCUT&RUN signal for different input materials (three replicates for each). A similar signal represents the reproducibility of FitCUT&RUN with low-input material. (B) Scatterplots presenting the high correlation of the ELF1 FitCUT&RUN signal between different input materials. (C) Venn diagram showing the overlap of ELF1 FitCUT&RUN peaks with different input cells. The majority of peaks based on the low-input material showed high overlap with those obtained from 1 × 10⁵ cells. (D) Box plots showing the normalized ELF1 FitCUT&RUN signal using 1 × 10⁵ cells in three groups of peaks, that is, only detected in the FitCUT&RUN using 1 × 10⁵ cells, overlap with FitCUT&RUN using 1 × 10⁴ cells, and overlap with FitCUT&RUN using 5 × 10³ cells. Peaks detected with reduced input material (5 × 10³ cells) show a higher signal than those in the other two groups, proving the reliability of FitCUT&RUN with low-input material.


