
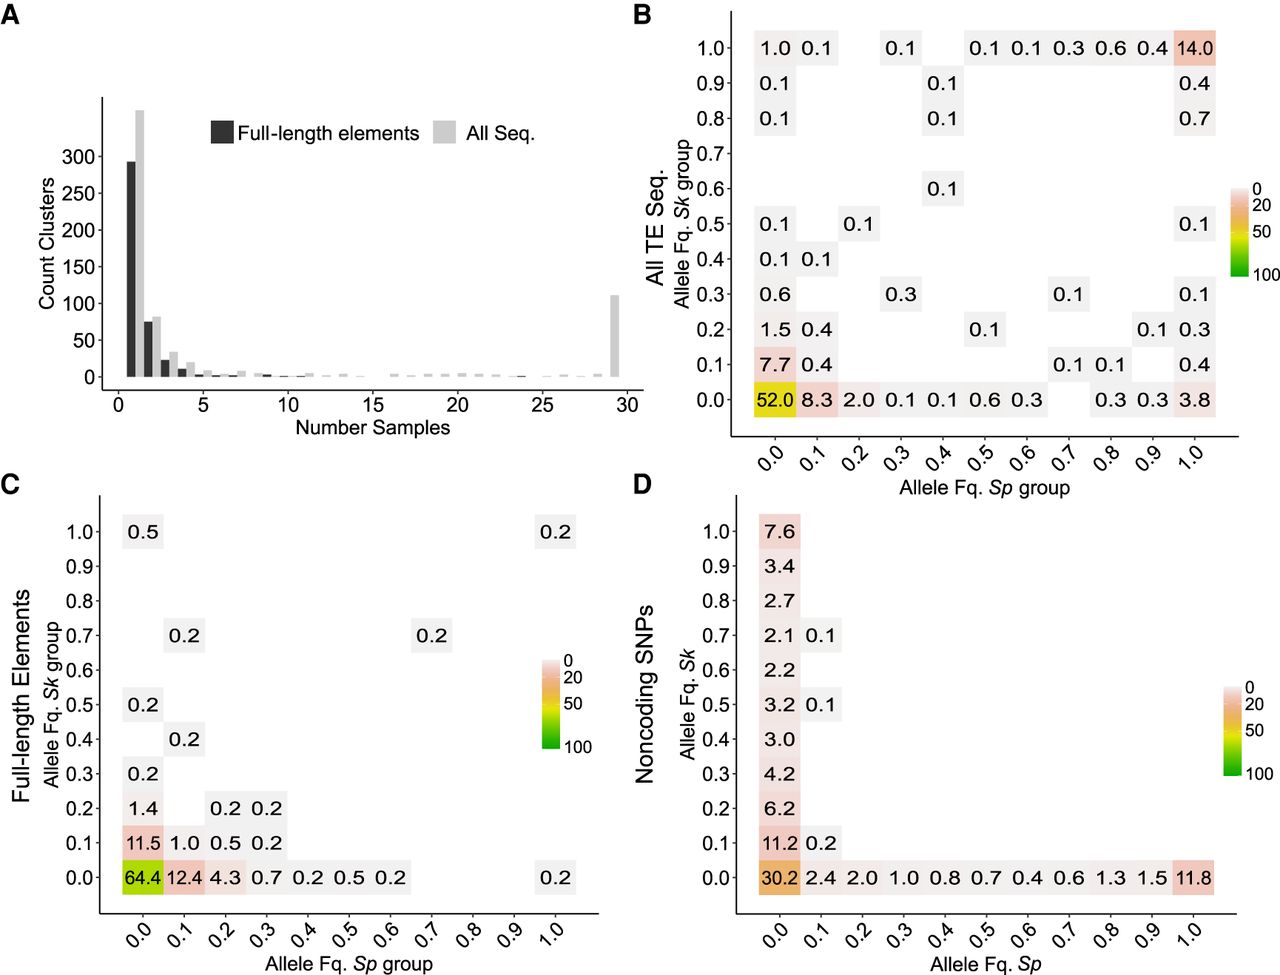
Allelic variation of LTR clusters between nonclonal strains. (A) One-dimensional site frequency spectrum summarizing the allelic frequency of TE cluster insertions across all 31 nonclonal strains. Bars differentiate between either all sequences or full-length elements. (B–D) Two-dimensional site frequency spectra showing the proportion of allele frequency bins shared between the ancestral Sp and Sk background for all TE sequences (B), full-length elements (C), and noncoding genome-wide SNPs (D). Site frequency spectra in B and C are unfolded, but folded in D. For folded spectra of B and C, see Supplemental Figure 14. Number and color range indicate the percentage out of all variants within each panel.


