
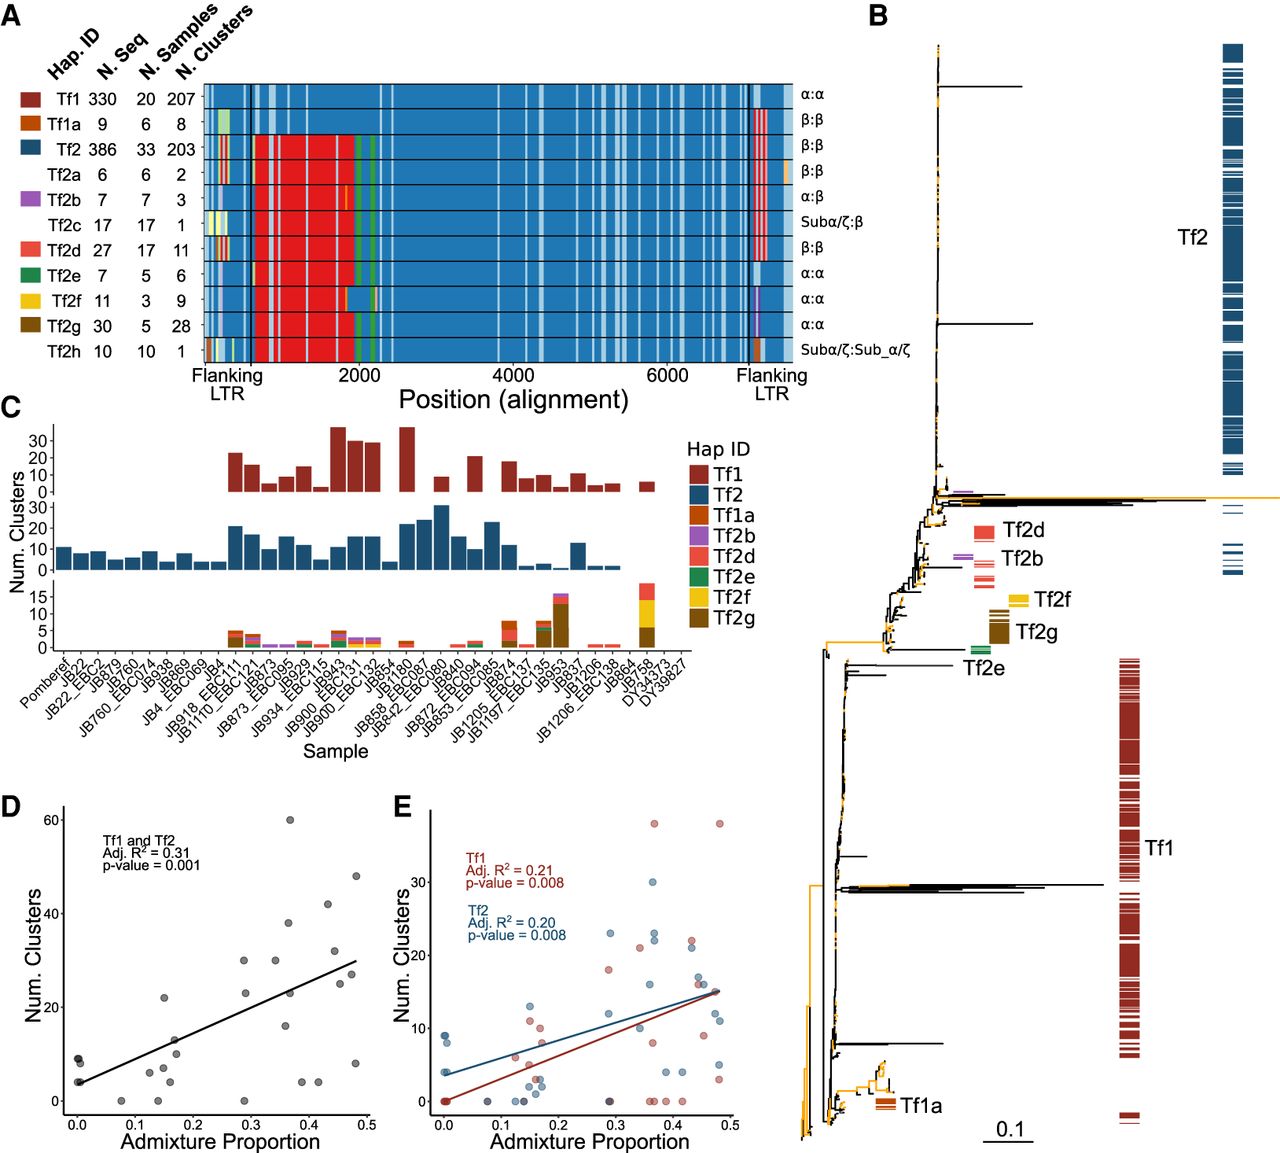
Diversity of full-length LTR elements. (A) Alignment of the 11 haplotypes identified by window-based haplotype painting in a global sample of S. pombe. For each haplotype we show haplotype ID, number of sequences found in all samples, number of samples, and number of independent TE clusters. Vertical black lines show boundaries of flanking LTRs. Colors per window (vertical comparison within the alignment) represent haplotype difference from TF1 used as reference. Owing to insertion–deletion polymorphism, the alignment exceeds the length of the individual full-length LTR elements. Flanking LTR families per haplotypes are shown at the right (5′ LTR:3′ LTR). (B) Maximum-likelihood unrooted tree for full-length LTRs. Branches with bootstrap support higher than 95 are shown in yellow. Colors correspond to the color assignment of the eight most common haplotypes in A. (C, bottom panel) Number of common haplotypes for full-length elements found in at least three independent clusters shown per sample. (Top and middle panels) Haplotypes Tf1 and Tf2 are shown in independent plots. Colors per haplotype ID as indicated. Samples are ordered by ancestral admixture from pure Sp to pure Sk as in Figure 1. (D) Relationship between ancestral Sp and Sk admixture proportions and the number of clusters with Tf1 and Tf2 full-length elements. Each point represents a nonclonal strain. The adjusted proportion of total variance explained (R2) and the type 1 error probability (P-value) are shown in the inset. (E) As in D but differentiating between haplotypes TF1 and TF2.


