
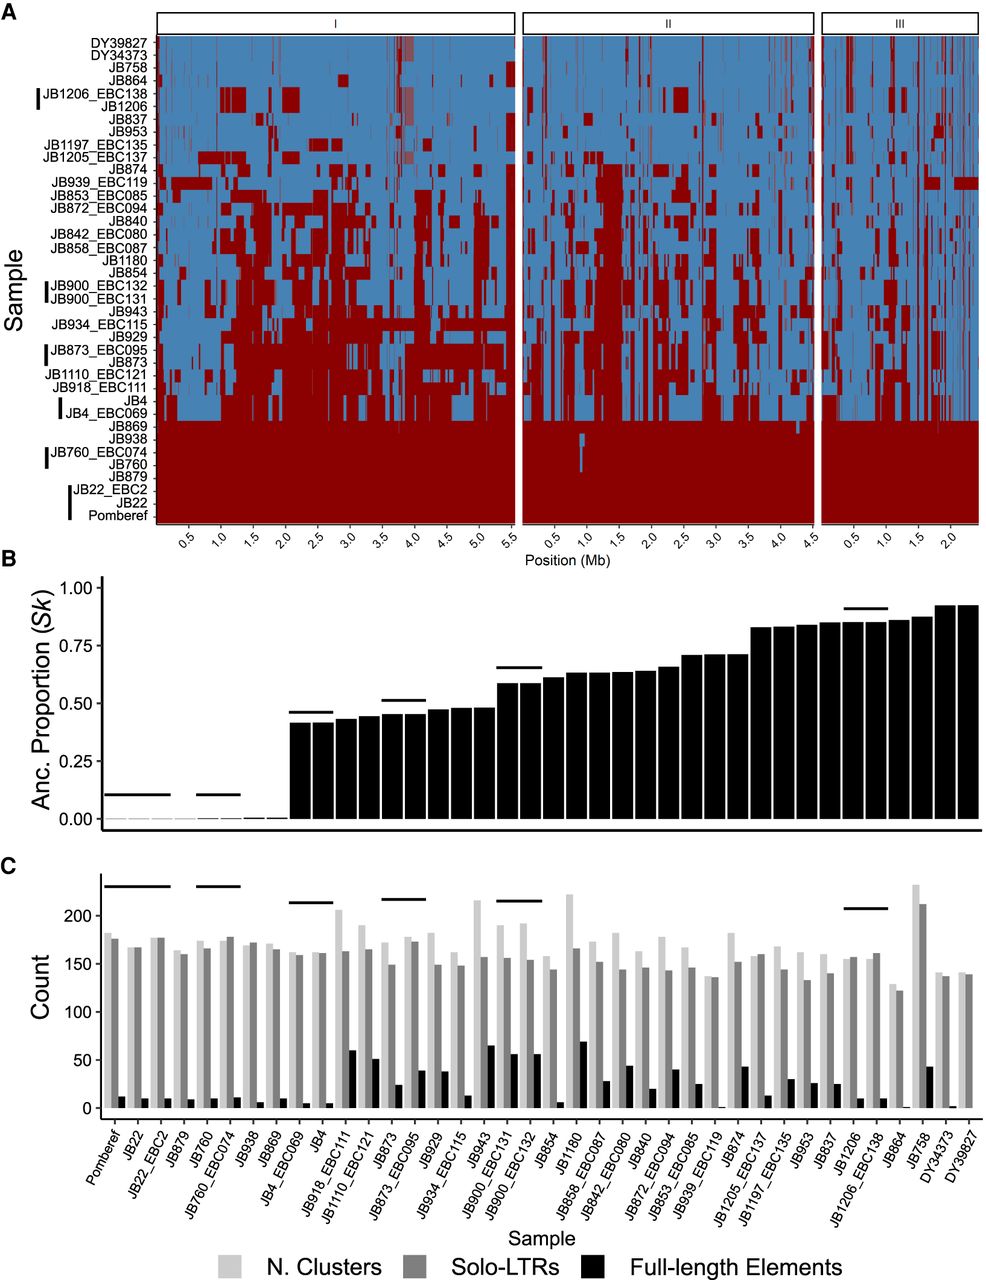
Genome composition by ancestry and LTR repertoire of a global collection of 38 samples corresponding to 31 nonclonal haploid S. pombe strains. (A) Heat map representing SNP-based haplotypes across all three chromosomes (I, II, and III) for the 38 samples used in this study. Six clonal samples derived from the same strain are indicated by vertical bars. Haplotypes are painted by Sp and Sk ancestry shown in red and blue color, respectively. For details on the inference of ancestry components, we refer to Tusso et al. (2019). (B) Distribution of Sk ancestry proportion per sample. (C) Number of solo-LTR sequences, full-length elements, and total number of clusters per strain. For a summary of the total number of TEs per strain, see Supplemental Figure 5. In all panels, clonal samples are grouped by horizontal black lines.


