
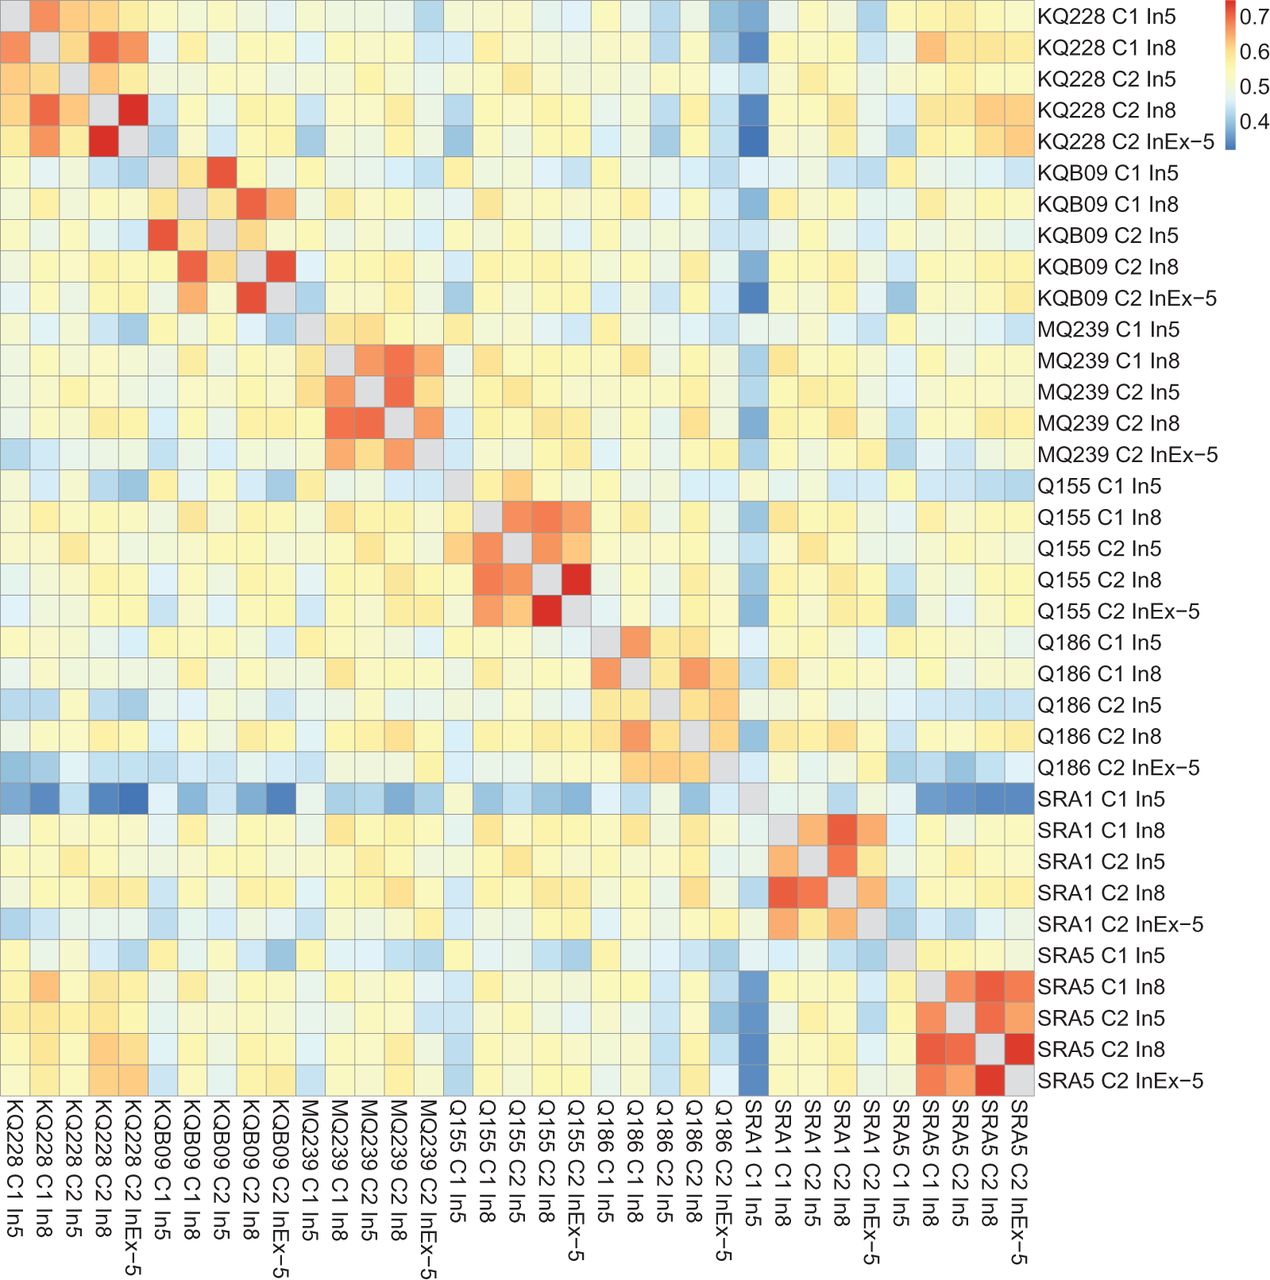
Figure 2.
Percentage of genes with allele-specific expression (ASE) detected in common for all genotype × internode combinations. We found higher similarity among different internodes of the same genotype (hot colors in the diagonal blocks), and there was also similarity between the same internode of different genotypes (the light orange cells off the main diagonal).


