
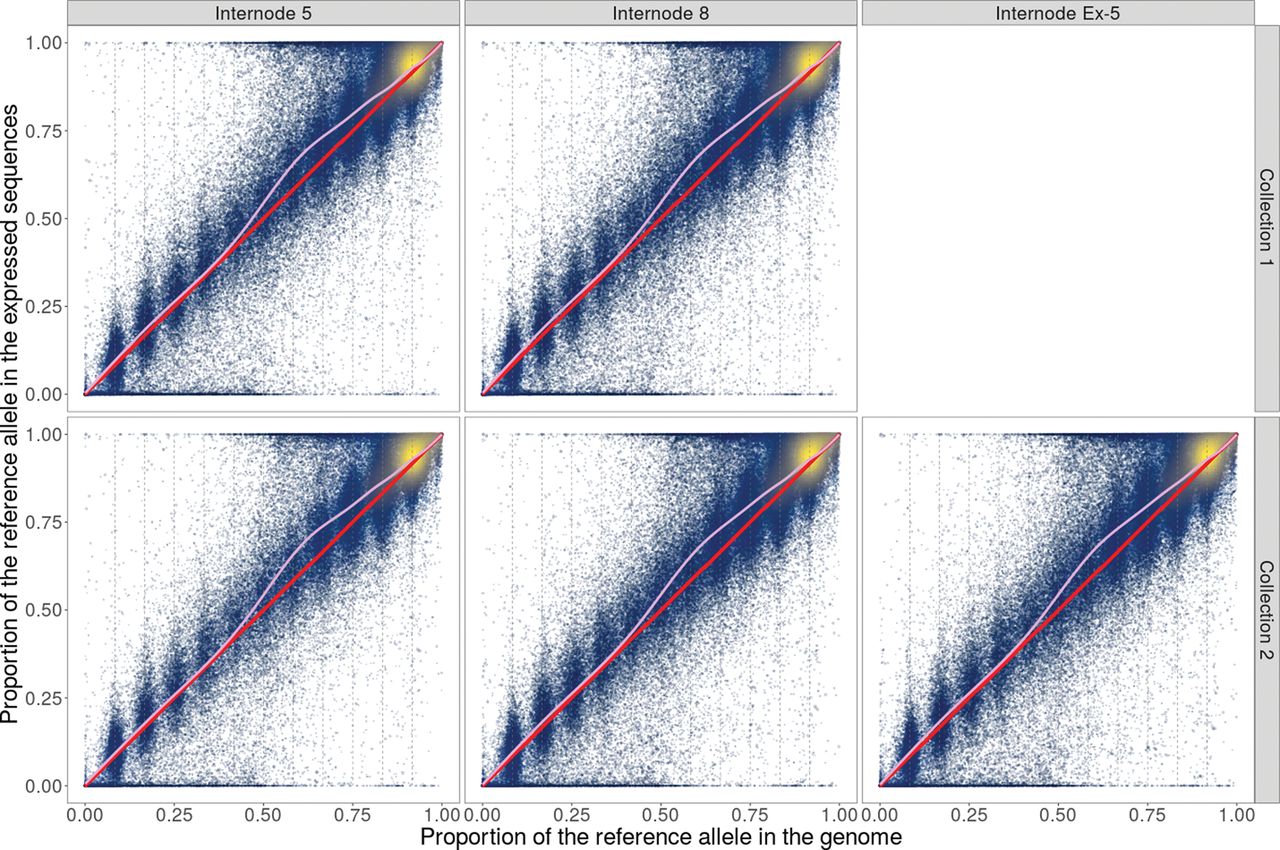
Relationship between expressed and genomic proportions of the reference allele for genotype KQ228. Different internodes are shown in separate panels. The red line indicates the null hypothesis of perfect identity between the expressed proportion of the reference allele (Υ; in the y-axis) and the corresponding genomic proportion (denoted by Γ; x-axis). Each point represents one single-nucleotide variant (SNV), and lighter colors indicate a higher density of points. The smoothed trend of observed points is shown in pink. Notice the majority of sites with high proportion of the reference allele in the genome. To highlight the discrete nature of clusters, we only show high-depth sites, with 1000 or more genomic reads and 80 or more RNA-seq reads.


