
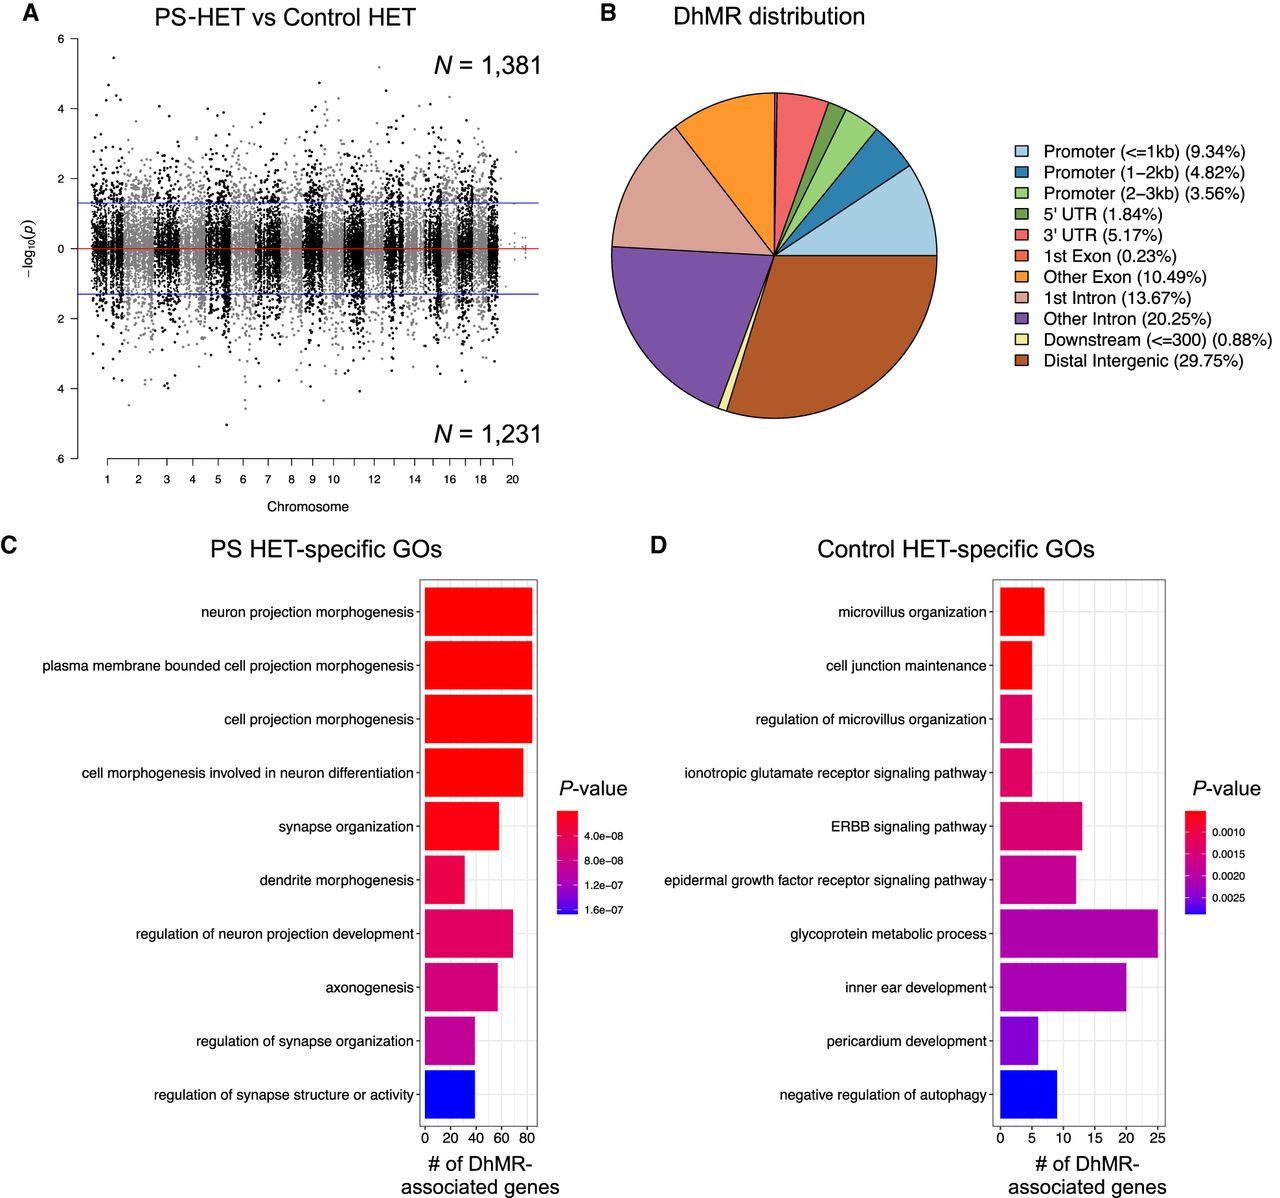
Distribution of hippocampal HET DhMRs. (A) A Manhattan plot shows the distribution of 5hmC sequenced data across the genome (x-axis; alternating black/gray for alternating cromosomes) and the level of significance [–log10(P-value)] along the y-axis. Dots above the top blue line represent PS-HET-specific (hyper)-DhMRs, whereas dots below the bottom blue line represent Control-HET-specific (hypo)-DhMRs (P-value < 0.05). (B) A pie chart displays the proportion of DhMRs across standard genomic structures. (C,D) Bar plot showing the top 10 significantly overrepresented GO terms (y-axis) based on GO analysis of PS-HET-specific DhMR-associated genes (C) and Control-HET-specific DhMR-associated genes (D). The number of DhMR-associated genes linked to the GO terms are displayed on the x-axis. Bar color is based on P-value.


