
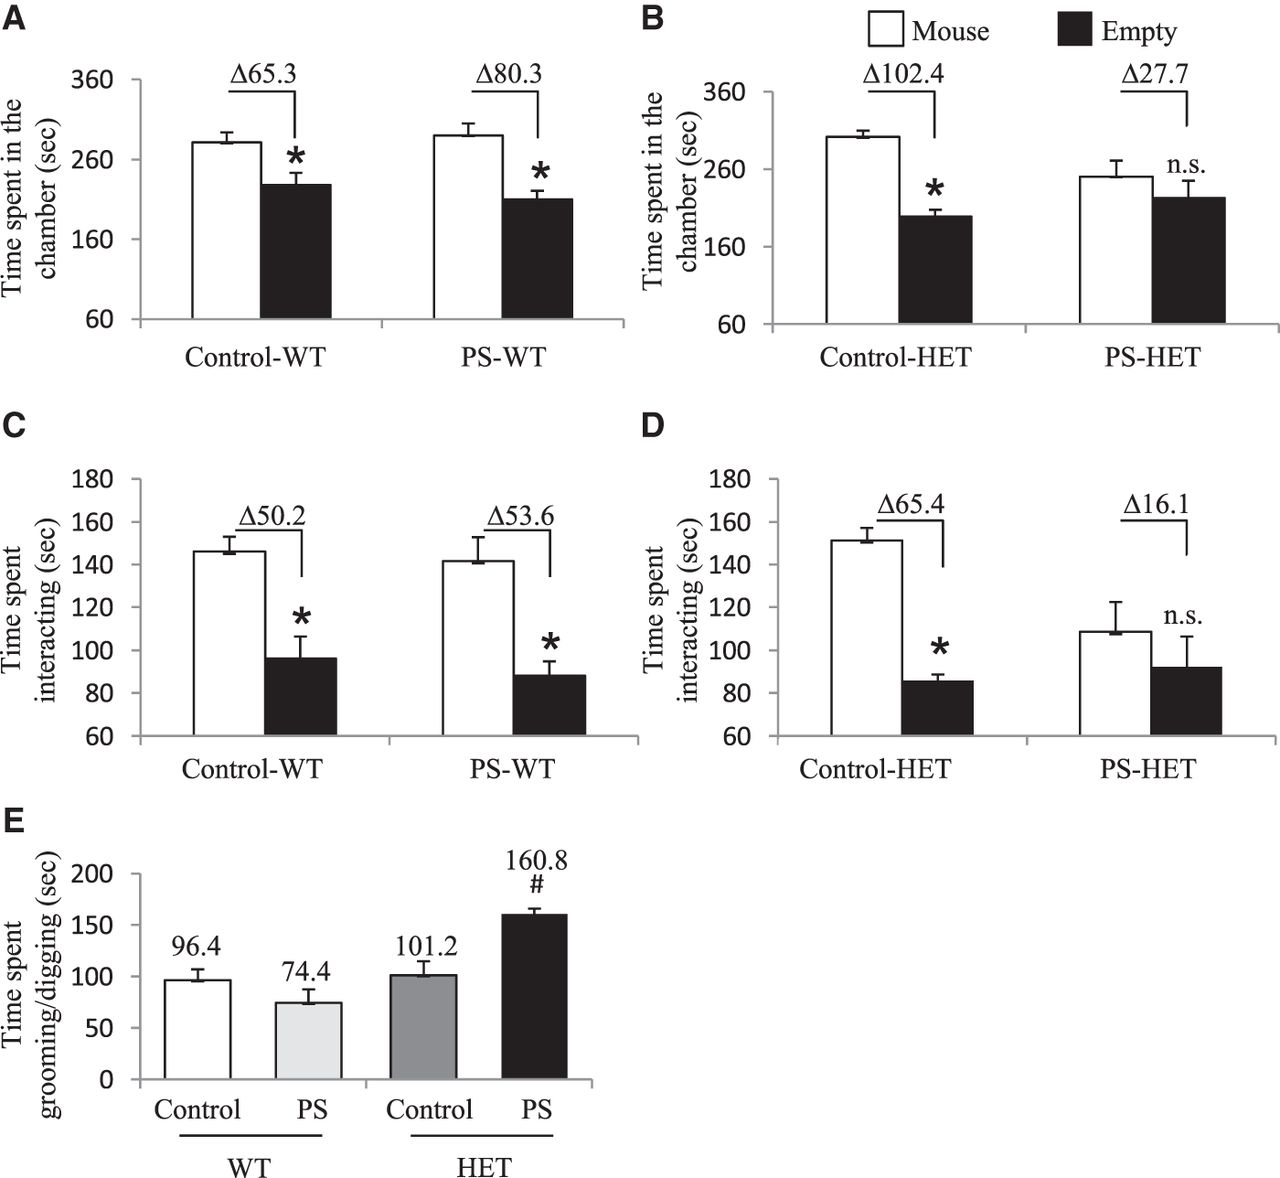
Results from social behavioral tests in female offspring. (A–D) Three-chamber social interaction test: (A,B) time spent in the chamber with either an unfamiliar mouse inside a cup (mouse) or with an empty cup (empty). Data analysis details: (A) two-way ANOVA for control-WT versus PS-WT groups—effect of time spent in either chamber, F(1,42) = 28.5, P-value < 0.001; and (B) two-way ANOVA for control-HET versus PS-HET groups—effect of time spent in either chamber, F(1,32) = 16.2, P-value < 0.001, and interaction between time spent in either chamber and treatment, F(1,32) = 5.3, P-value = 0.002. (C,D) Time spent interacting with either an unfamiliar mouse inside a cup (mouse) or with an empty cup (empty). Data analysis details: (C) two-way ANOVA for control-WT versus PS-WT groups—effect of time spent interacting, F(1,42) = 29, P-value < 0.001; and (D) two-way ANOVA for control-HET versus PS-HET groups—effect of time spent interacting in either chamber, F(1,32) = 9.9, P-value = 0.003. All asterisks denote P-value ≤ 0.05, two-way ANOVA with Bonferroni multiple comparison test–determined post hoc significance. Δ denotes the difference in time spent. (E) Ten-minute reciprocal social interaction test in female offspring. One-way ANOVA detected effect of groups on time spent grooming/digging during a 10-min reciprocal social interaction test (F(3,16) = 10.9, P-value < 0.001). Hashtag (#) denotes significance for time spent grooming/digging between PS-HET in comparison to Control-WT, Control-HET, and PS-WT (P-value < 0.05). N = 9–10 per treatment for each genotype.


