
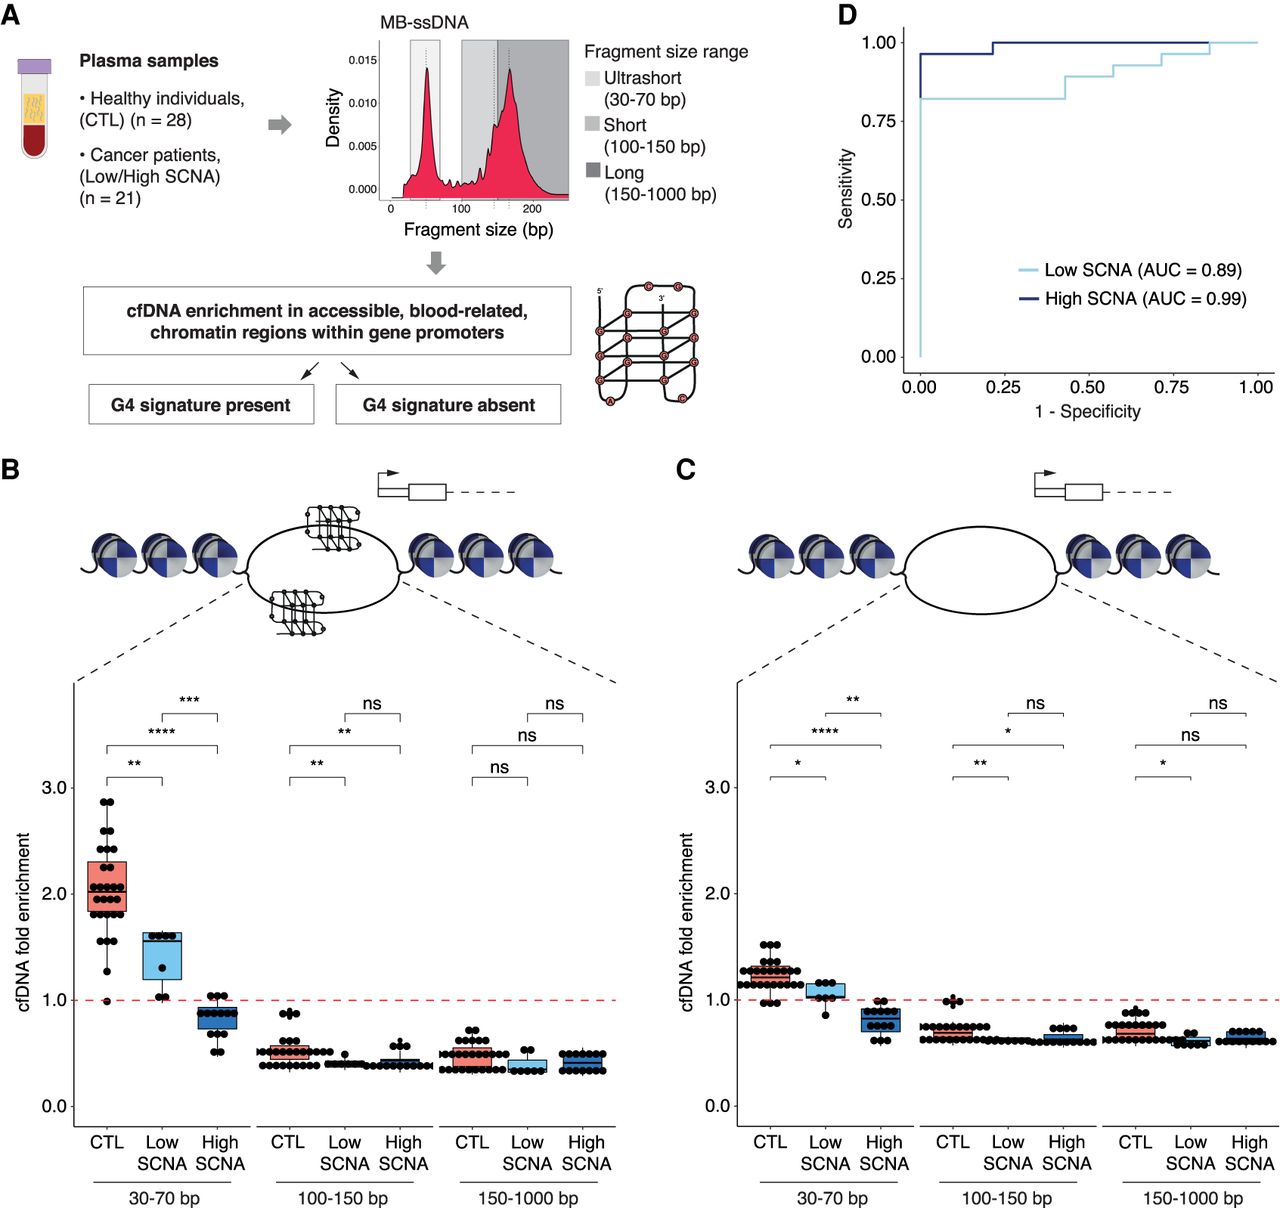
Assessment of cfDNA enrichment in accessible blood-related chromatin regions within gene promoters that contain or lack a G4 signature in MB-ssDNA libraries. (A) Schematics of the assessment of plasma cfDNA fold enrichment in genomic regions associated with predicted quadruplex sequences (PQS) that have been previously observed to adopt G4 structures (observed quadruplex sequences [OQS]), denoted as PQS/OQS regions. (B,C) Fold enrichment of cfDNA fragments in accessible blood-related chromatin regions within gene promoters that contain (B) or lack (C) a G4 signature at different fragment sizes (30–70, 100–150, 150–1000 bp) in samples from healthy individuals and cancer patients. The red dashed line indicates no enrichment relative to random permutation. (D) ROC curve analysis of US cfDNA fold enrichment in accessible blood-related chromatin regions within gene promoters that contain a G4 signature, for discriminating cancer patients from the healthy individuals using MB-ssDNA protocol. Wilcoxon rank-sum test: (*) P < 0.05; (**) P < 0.01; (***) P < 0.001; (****) P < 0.0001; (ns) nonsignificant.


