
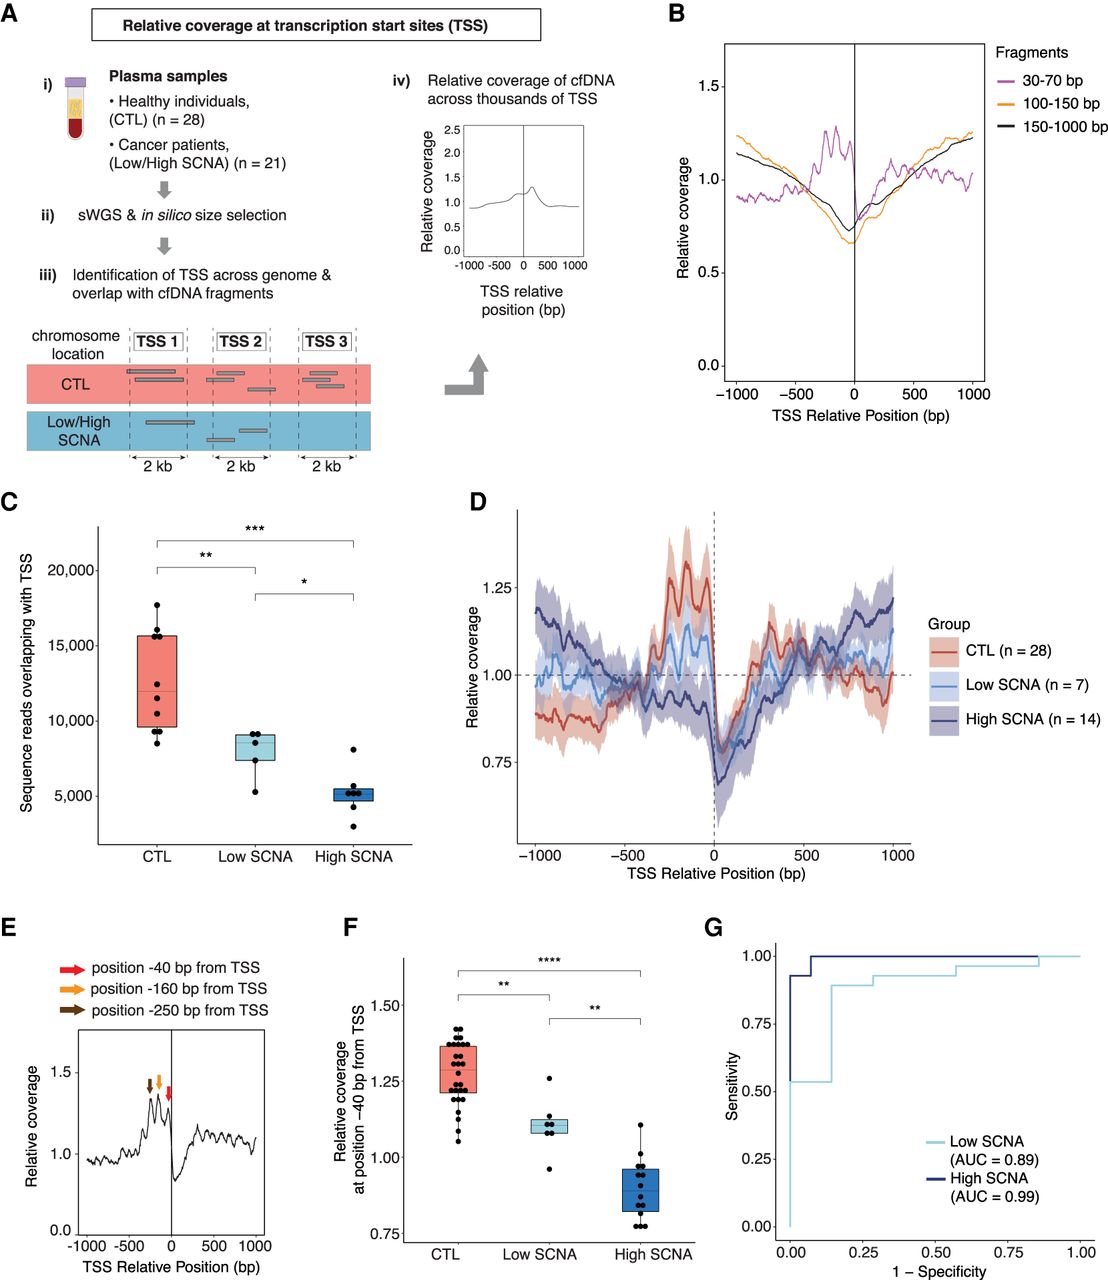
Assessment of plasma cfDNA sequence coverage near TSS in MB-ssDNA libraries. (A) Schematics of TSS coverage analysis in plasma cfDNA samples. (B) The relative coverage near TSS in MB-ssDNA libraries derived from pooled sWGS data of 10 healthy individuals assessed in different fragment size ranges. (C) The number of US cfDNA fragments overlapping with TSS regions in individual MB-ssDNA libraries derived from healthy individuals and cancer patients. (D) The relative coverage of US cfDNA fragments near TSS in samples from healthy individuals and cancer patients. The mean and standard deviation of the data are shown. (E) Schematic of the assessment of the density of US cfDNA fragments at specific positions relative to TSS. (F) The relative coverage of US cfDNA fragments at the position 40 bp upstream of TSS. (G) ROC curve analysis of the relative density at the “−40 bp” position for discriminating cancer patients from the healthy individuals. Wilcoxon rank-sum test: (*) P < 0.05; (**) P < 0.01; (***) P < 0.001; (****) P < 0.0001.


