
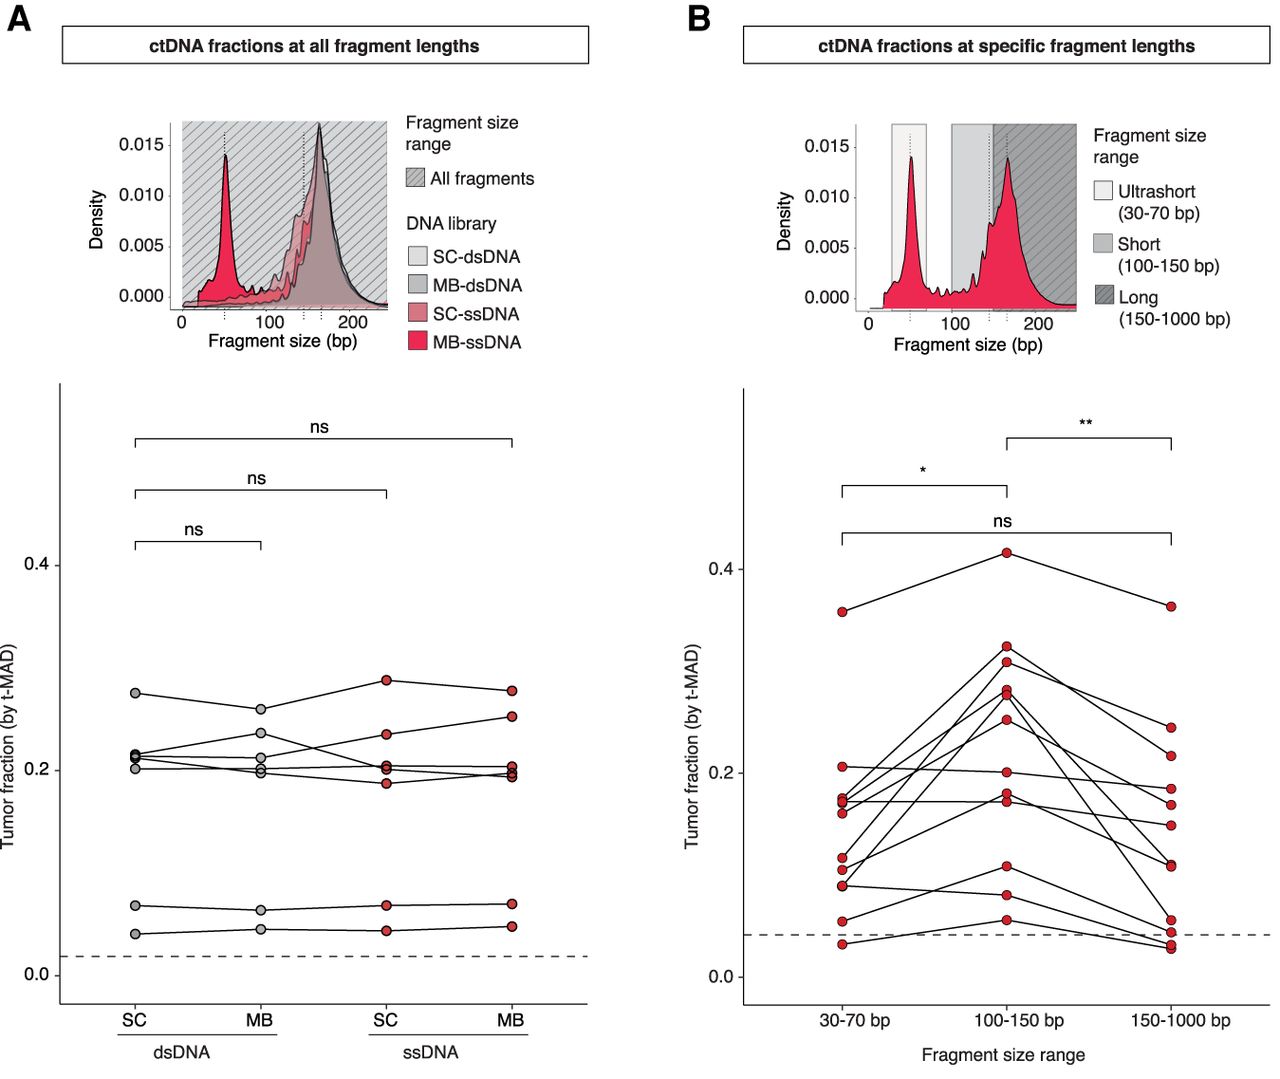
Plasma ctDNA fractions at all and specific DNA fragment lengths. (A) Schematic of the selection of all DNA fragment size ranges and comparison of t-MAD scores between different protocols. Tumor fractions as inferred by sWGS and t-MAD analysis, of samples from patients with high SCNA levels (seven patients and 28 plasma samples). The dashed line indicates a t-MAD threshold of 0.019 (inferred from a cohort of healthy individuals, sequence data down-sampled to 5 million reads). (B) Schematic of the selection of three different fragment size ranges. The t-MAD scores for plasma DNA from 12 cancer patients after in silico size selection of fragments between 30 – 70, 100 – 150, and 150 – 1000 bp in length. The t-MAD scores were plotted separately for different DNA size fragment bins. The dashed line indicates a t-MAD threshold of 0.0416 (inferred from a cohort of healthy individuals, sequence data down-sampled to 1.25 million reads). Wilcoxon signed-rank paired test: (*) P < 0.05; (**) P < 0.01; (ns) nonsignificant.


