
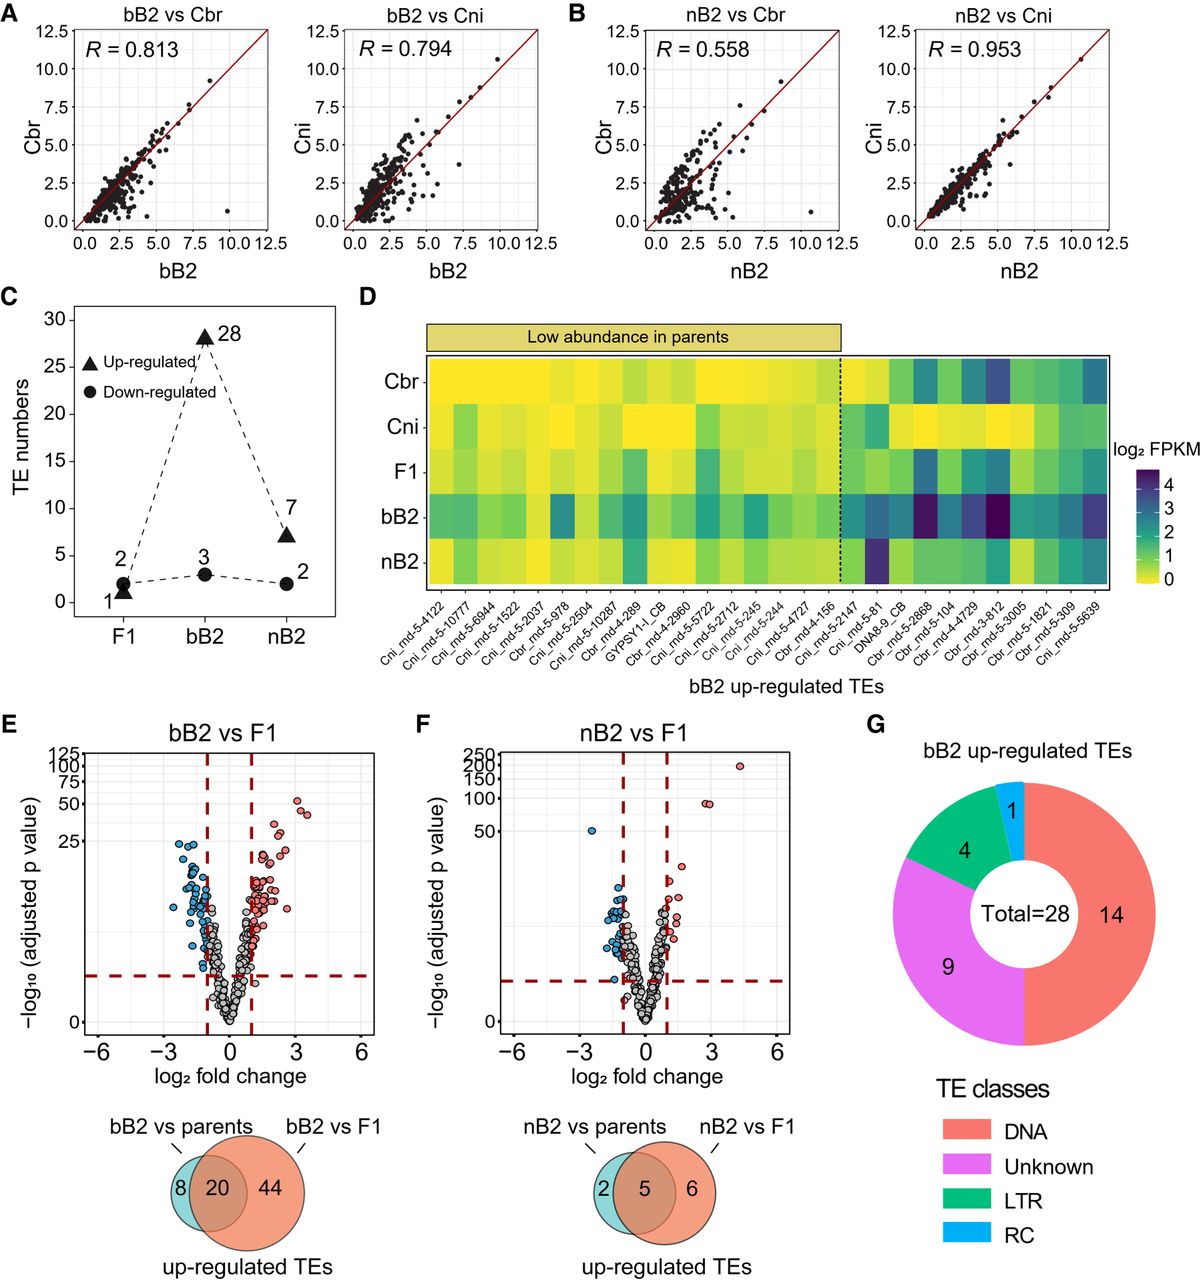
TEs show a disproportionately higher level of misregulation in the bB2 embryos than in the nB2 embryos. (A,B) Pairwise comparison of normalized counts of read mapped to individual TE families (abbreviated as TEs, see Methods) between bB2 (A) or nB2 embryos (B) and parental embryos. Each dot represents a single TE family. Also shown is Pearson's correlation coefficient (R). (C) Number of significantly up- (triangle) and down-regulated TE families (circle) in F1, nB2, and bB2 embryos as indicated. (D) A heatmap showing the normalized count of the reads mapped to the 28 TEs that are significantly up-regulated in the bB2 embryos in the parental and hybrid embryos. TEs are divided into four categories (see Methods). Scale of expression intensity is shown on the right. (E,F) Top: Volcano plots of log2 fold changes (FC) of TE expression in the bB2 (E) or nB2 (F) embryos compared with that in the F1 embryos. The significantly up-, down-regulated TEs, or those without significant change TEs, are differentially colored in red, blue, and gray, respectively. Bottom: Venn diagrams show the number of significantly up-regulated TE numbers in bB2 or nB2 embryos compared with parental or F1 embryos. (G) Pie chart showing the breakdown of the 28 significantly up-regulated TEs in the bB2 hybrid at class level.


