
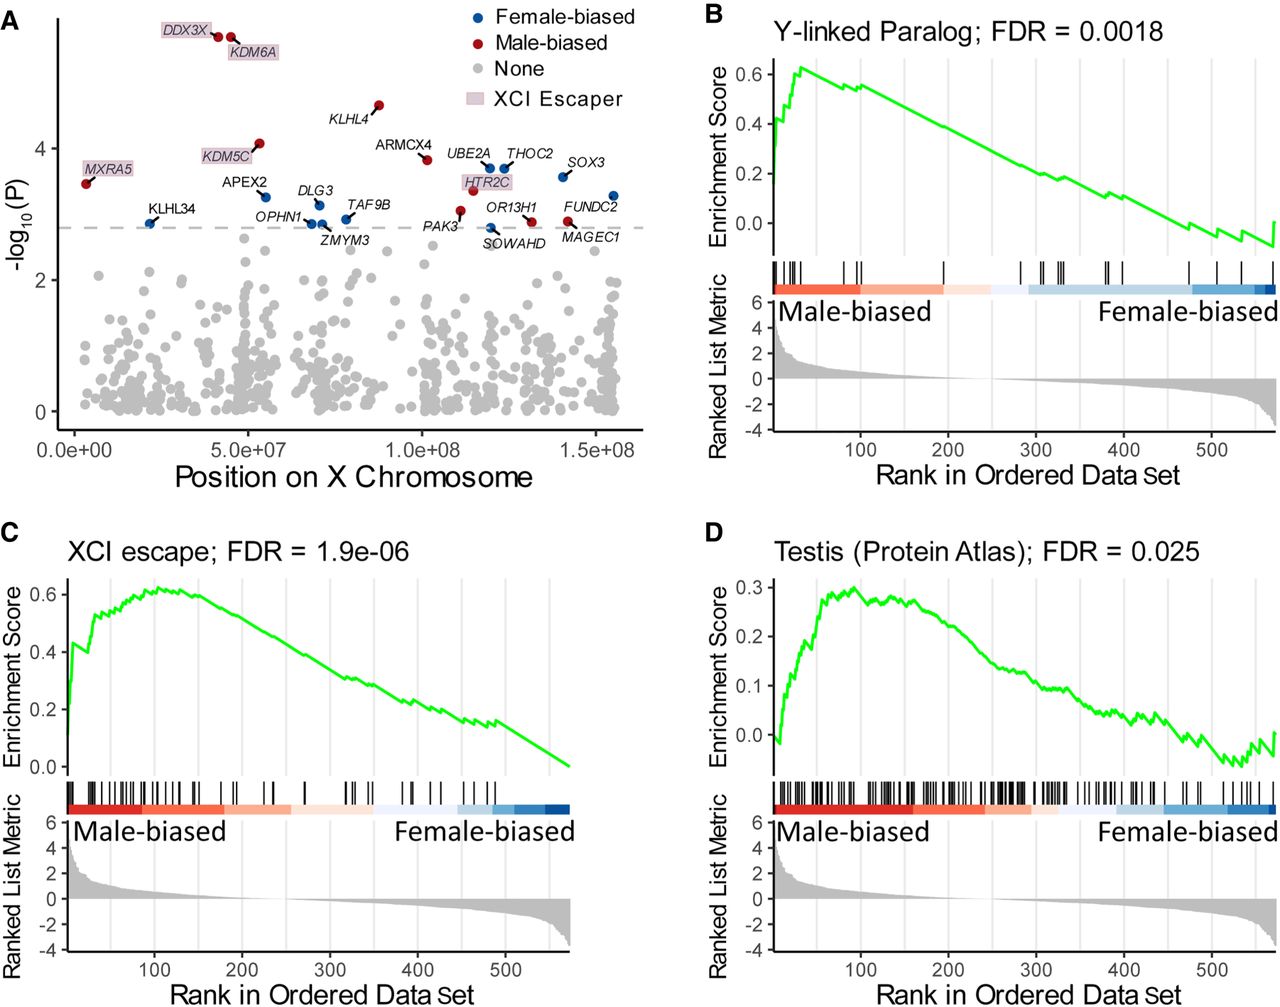
Genes with sex-biased somatic mutations in cancer tumors. (A) X-linked genes show sex bias in rates of somatic mutations. Values are the −log10 of the P-values for differences in mutation rates between males and females as a function of the positions of the genes on the X Chromosome. Genes that escape from XCI are highlighted. (B–D) GSEA plots. The vertical black lines indicate the position of genes in the sets relative to all X-linked genes that are ranked from the most significant male-biased genes to the most significant female-biased genes. The green curve is the enrichment score based on a weighted running sum. (B) GSEA plot for Y-linked paralogs. (C) GSEA plot for XCI escape genes. (D) GSEA plot for genes expressed predominantly in the testis, based on data from the Human Protein Atlas.


