
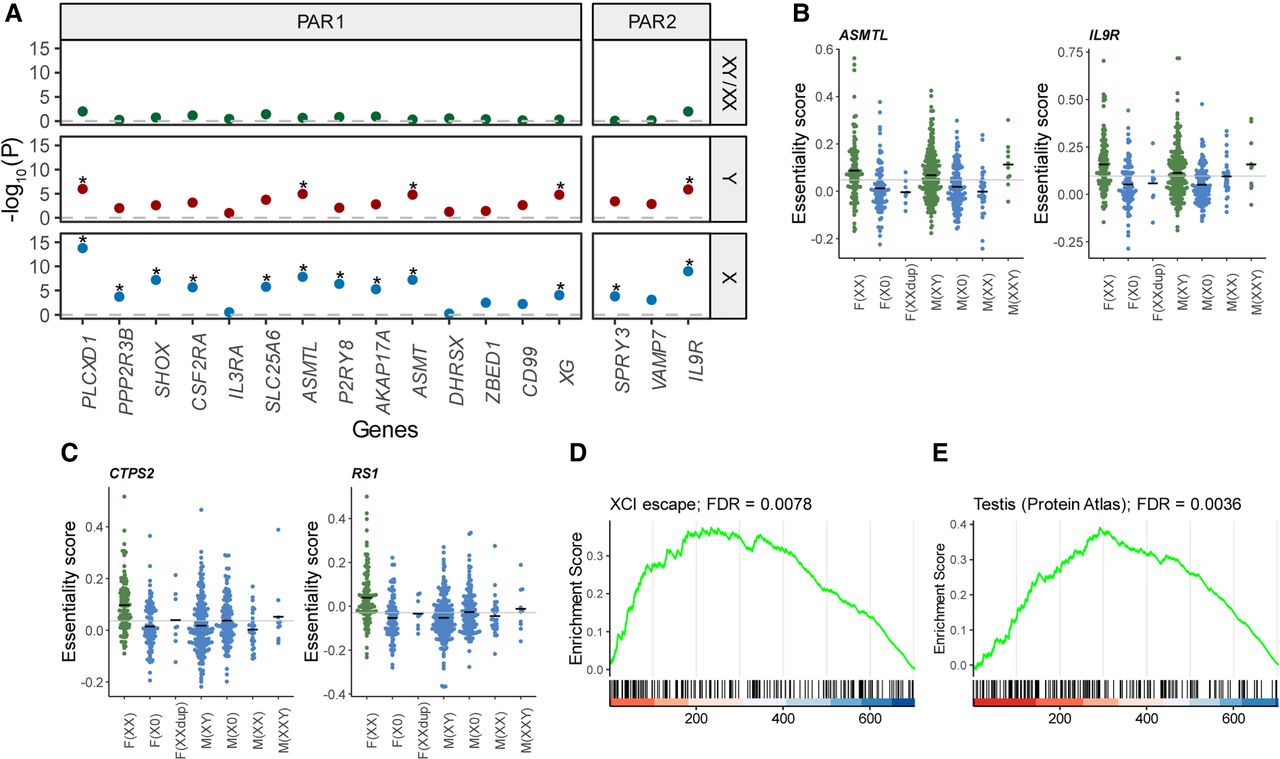
Characterization of genes associated with the X Chromosome. (A) Association of genes in the PARs with X and Y Chromosome dosage. Values are the −log10 of the P-values for the differences in essentiality score between female XX and male XY cell lines (top), the association of the essentiality score with the Y Chromosome (middle), and the association with the X Chromosome (bottom). The dashed line shows a P-value = 1. Genes with FDR < 0.05 are flagged with a star. (B,C) Distribution of essentiality scores across cell lines with different sex chromosome dosages. In green are groups that show a higher mean essentiality score. The gray line is the average across the cell lines. The black lines are the mean value for each group. (B) Example of two genes located in the PAR. (C) Example of two X-linked genes located outside the PAR. (D,E) Gene-set enrichment analysis (GSEA) plots. The position of genes in the gene set is marked with vertical bars. The genes are sorted based on the association significance with the X Chromosome. The green curve is the enrichment score based on a weighted running sum. (D) GSEA plot for escape and variable escape genes (as one group). (E) GSEA plot for genes expressed predominantly in the testis, based on data from the Human Protein Atlas.


