
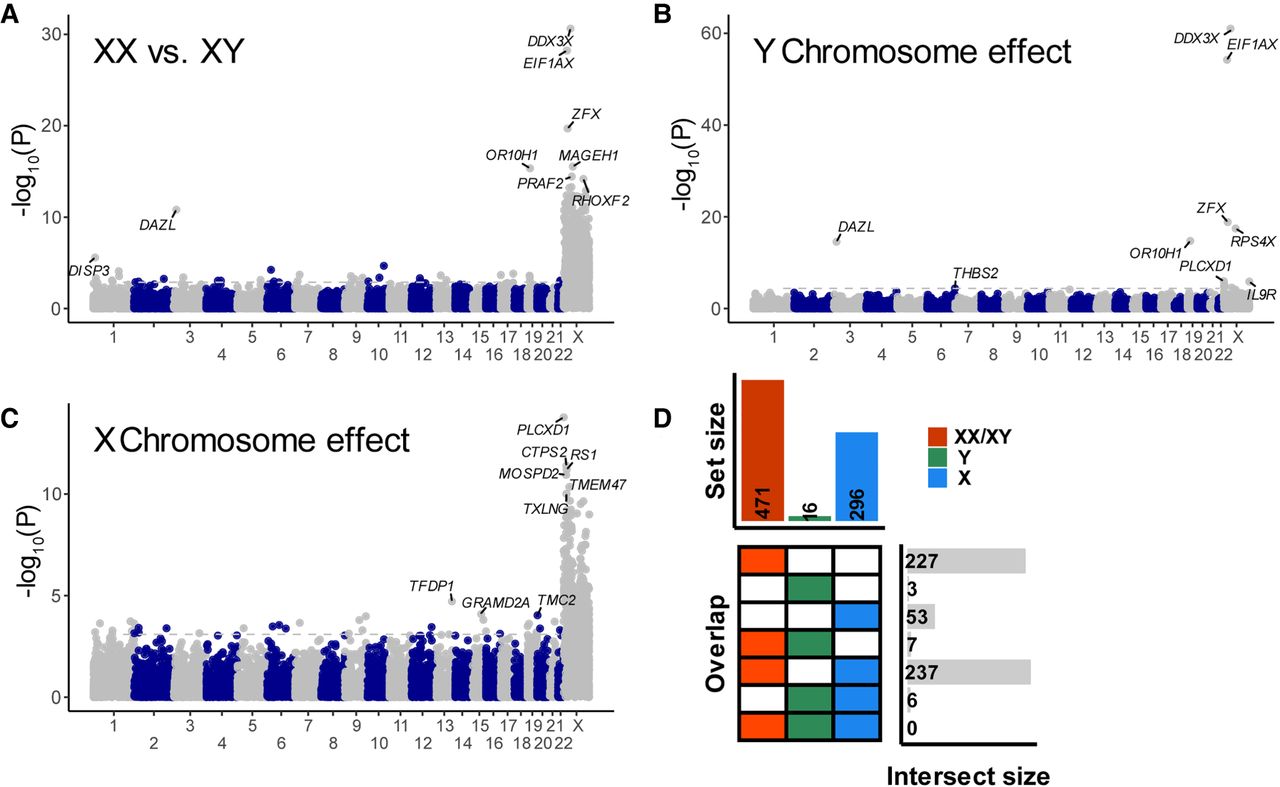
The sex chromosomes influence gene essentiality. (A–C) The Manhattan plots show the genome-wide significance for differences in essentiality score. Values are the −log10 of the P-values as a function of the chromosomal positions of genes. Results are shown for three tests: (A) differences in essentiality score between female XX and male XY cell lines, (B) association with the presence of the Y Chromosome, and (C) association with the number of X Chromosomes. The dashed line denotes a threshold of FDR = 0.05. The names of the six most significant X-linked genes and three autosomal genes are shown. (D) The level of overlap between significant genes in the three tests. The set size (top bar plot) shows the total number of significant genes in each test. The overlap (bottom left plot) shows different comparisons in each row. Genes uniquely identified as significant by a single test are represented as single-colored boxes, and overlaps are shown by two- or three-colored boxes. The intersect size (bottom right plot) shows the number of genes that overlap or are unique to each test.


