
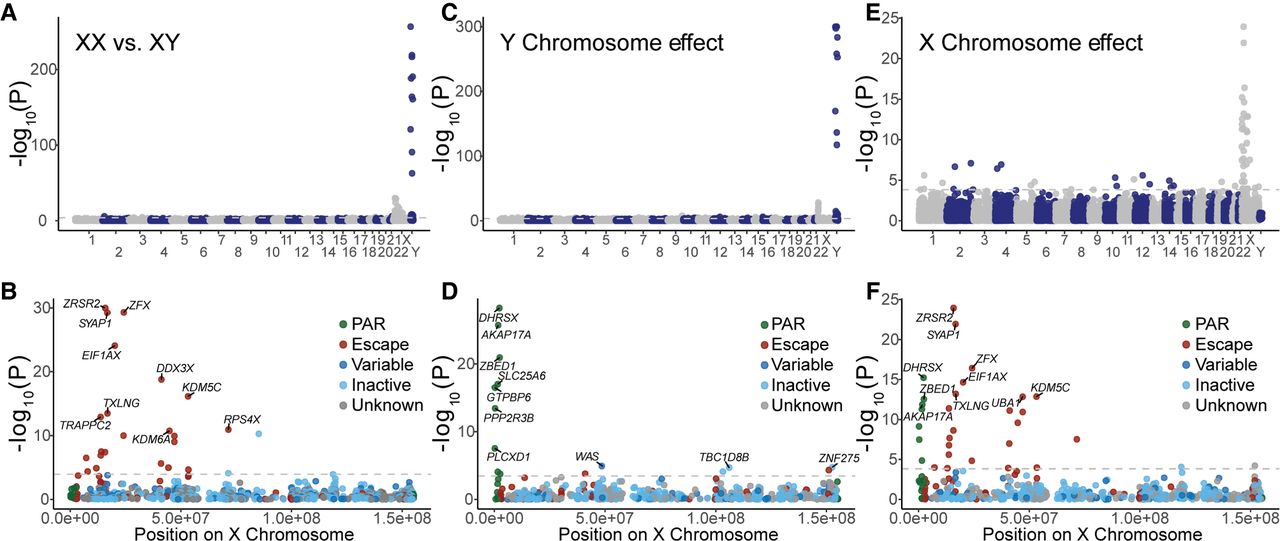
Gene expression is influenced by sex chromosomes. Manhattan plots of the differential expression analysis, showing the −log10 of the P-values as a function of the chromosomal positions of genes. Results are shown for three tests: (A,B) differences between female XX and male XY cell lines, (C,D) association with the presence of the Y Chromosome, and (E,F) association with the number of X Chromosomes. The dashed line denotes a threshold of FDR = 0.05. The upper plots (A,C,E) show the results of genome-wide expression analysis, and the lower plots (B,D,F) show the results for the X Chromosome. The different colors indicate genes on the PARs and the X-inactivation status for the rest of the genes. The names of the 10 most significant genes are shown.


