
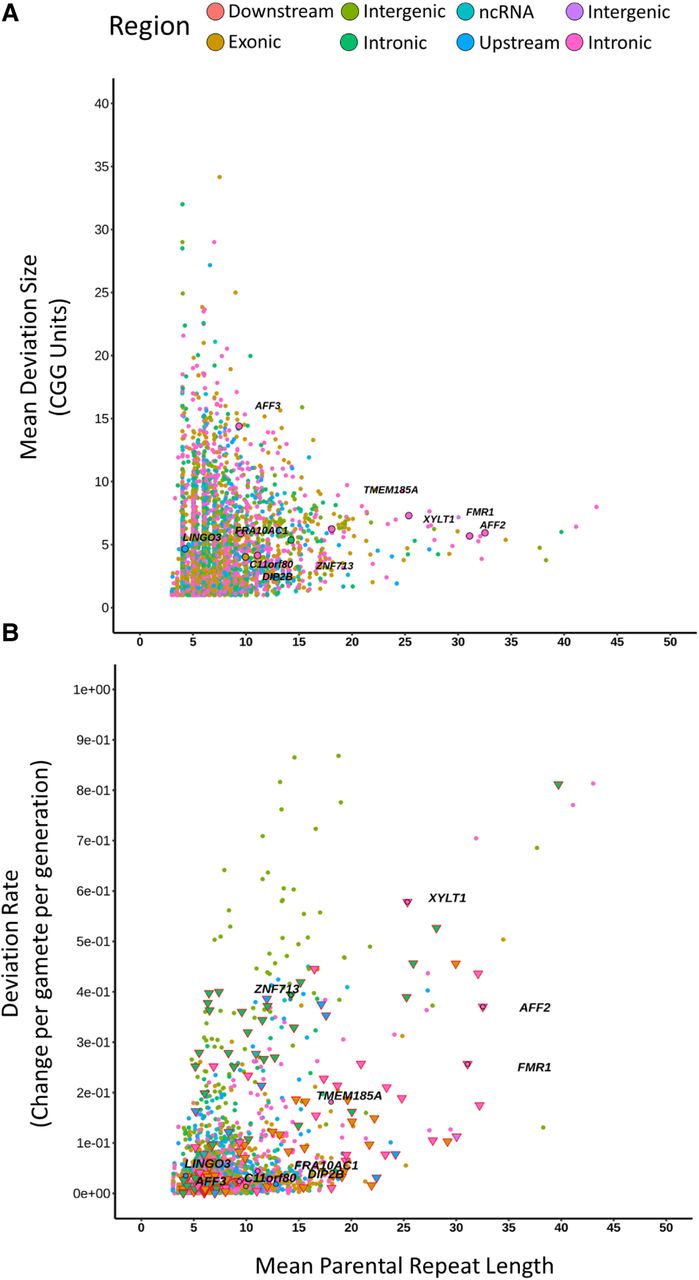
Illustration of the deviation characteristics of the CGG short tandem repeats that were determined to display polymorphism within the screened cohorts. (A) Generational repeat length deviation rate versus the average parental repeat length and (B) mean repeat length deviation size versus the average parental repeat length of all CGG repeat loci that displayed at least one deviating proband–parent genotype. Each point represents a unique CGG repeat locus. Color represents the genetic region in which the repeat is localized. Triangles represent the repeats that are localized within genes associated with neurodevelopmental/neurodegenerative disorders. Several known highly mutable and disease-causing repeats are highlighted for comparison. The absolute value was reported regarding deviation size, and contractions and expansions were not differentiated from each other.


