
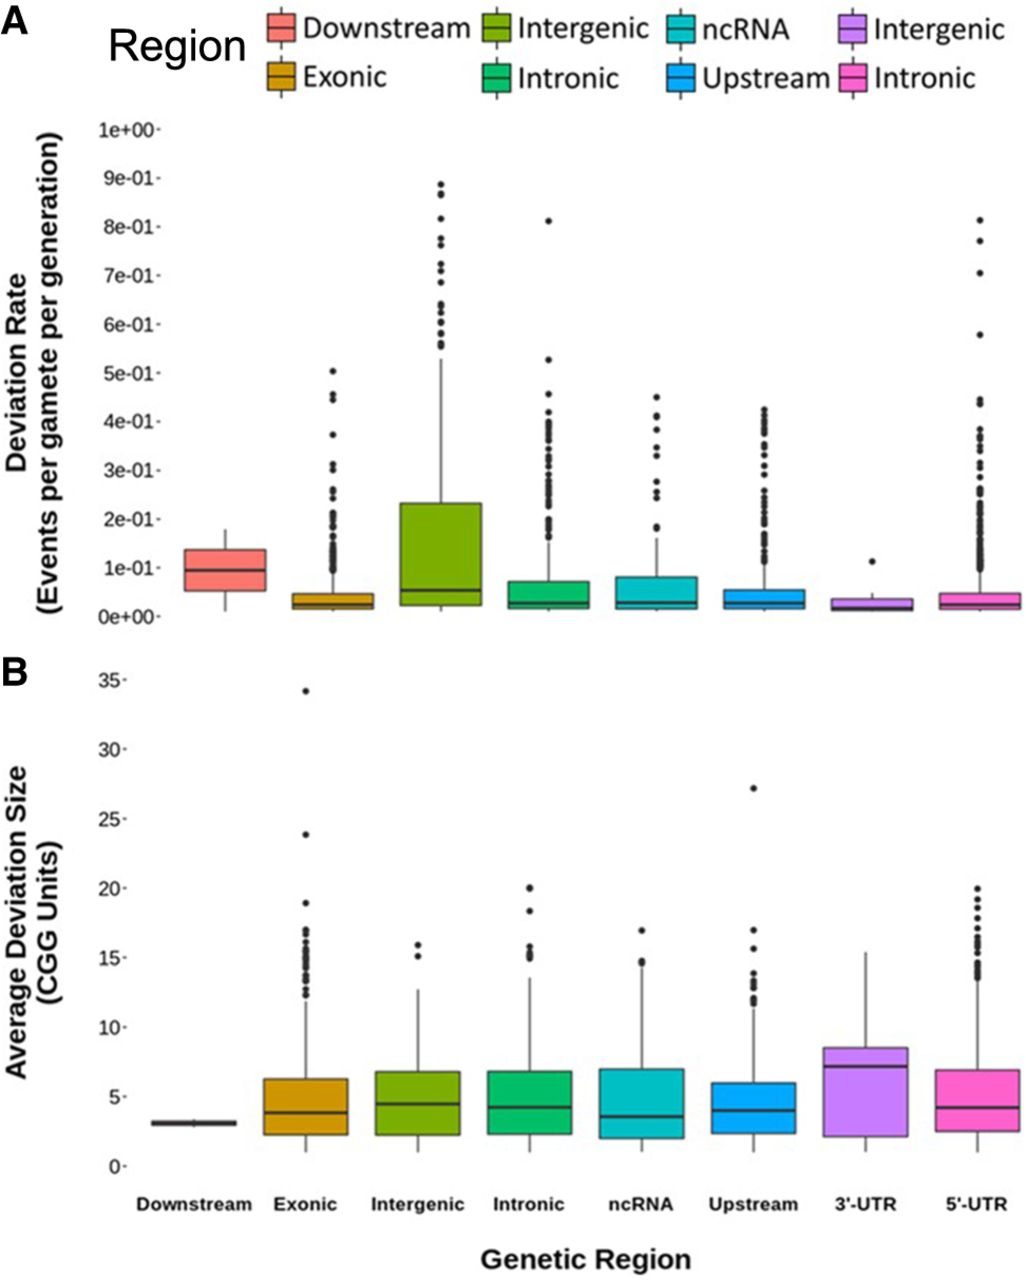
A comparison of CGG short tandem repeat characteristics between the specified genetic regions. (A) Distribution of repeat deviation rate of all unusually mutable CGG STR loci within the different genetic regions and (B) distribution of the mean deviation size for each CGG repeat per given genetic region. (A) Intergenic regions display, by far, the largest rate of CGG repeat variation than any given region. (B) Despite differences in the rate of deviation, on average, CGG repeats show comparable behaviors at the level of genetic regions. The one difference can be seen in the downstream region. Note that outliers have been removed from the display in order to improve figure resolution.


