
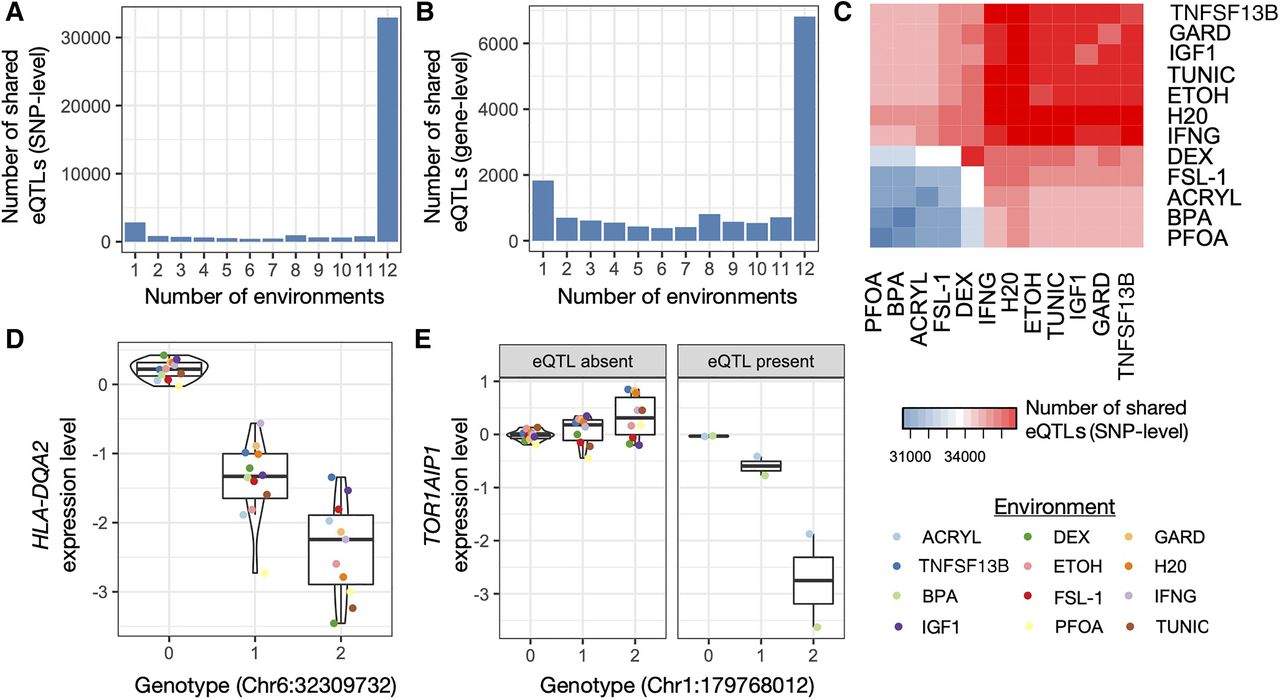
Environmental variation reveals context-dependent eQTLs. (A) Number of eQTLs shared between N environments using a mashR, a joint analysis approach. N is plotted on the x-axis and ranges from one (i.e., the eQTL is present in only one cellular environment) to 12 (i.e., the eQTL is present in all 12 cellular environments). (B) Same plot as in A, but sharing is defined at the gene rather than the SNP level. (C) Number of eQTLs shared between a given pair of cellular environments using a mashR, a joint analysis approach. The diagonal represents the number of eQTLs in the focal cellular environment. Note that ACRYL, BPA, PFOA, and FSL-1 had lower sample sizes than the other eight cellular environments, and their clustering thus reflects differences in power. (D,E) Examples of ubiquitous and context-dependent eQTLs, identified using a mashR, a joint analysis approach. The y-axis shows the mean, normalized expression levels for a given gene estimated in each environment, after regressing out three surrogate variables.


