
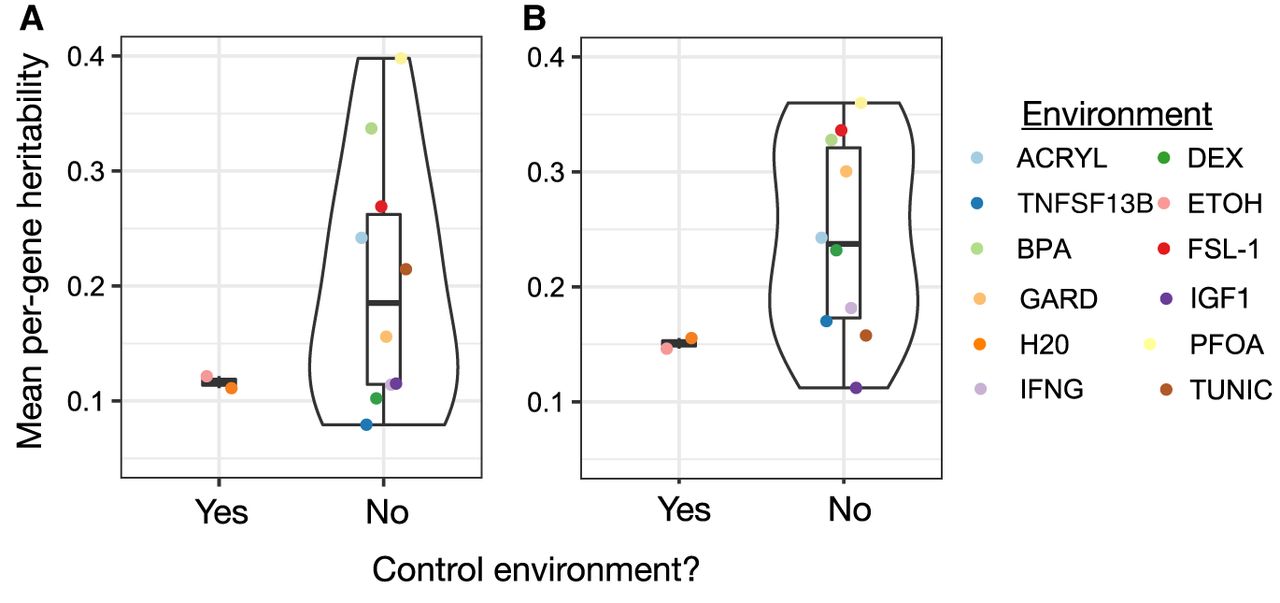
Figure 3.
Environmental perturbations increase the heritability of gene expression levels. The y-axis shows the mean per-gene heritability estimated in each environment, using (A) the total available sample size for each environment or (B) a subsample of n = 100 from each environment (plot shows the average of five subsamples).


