
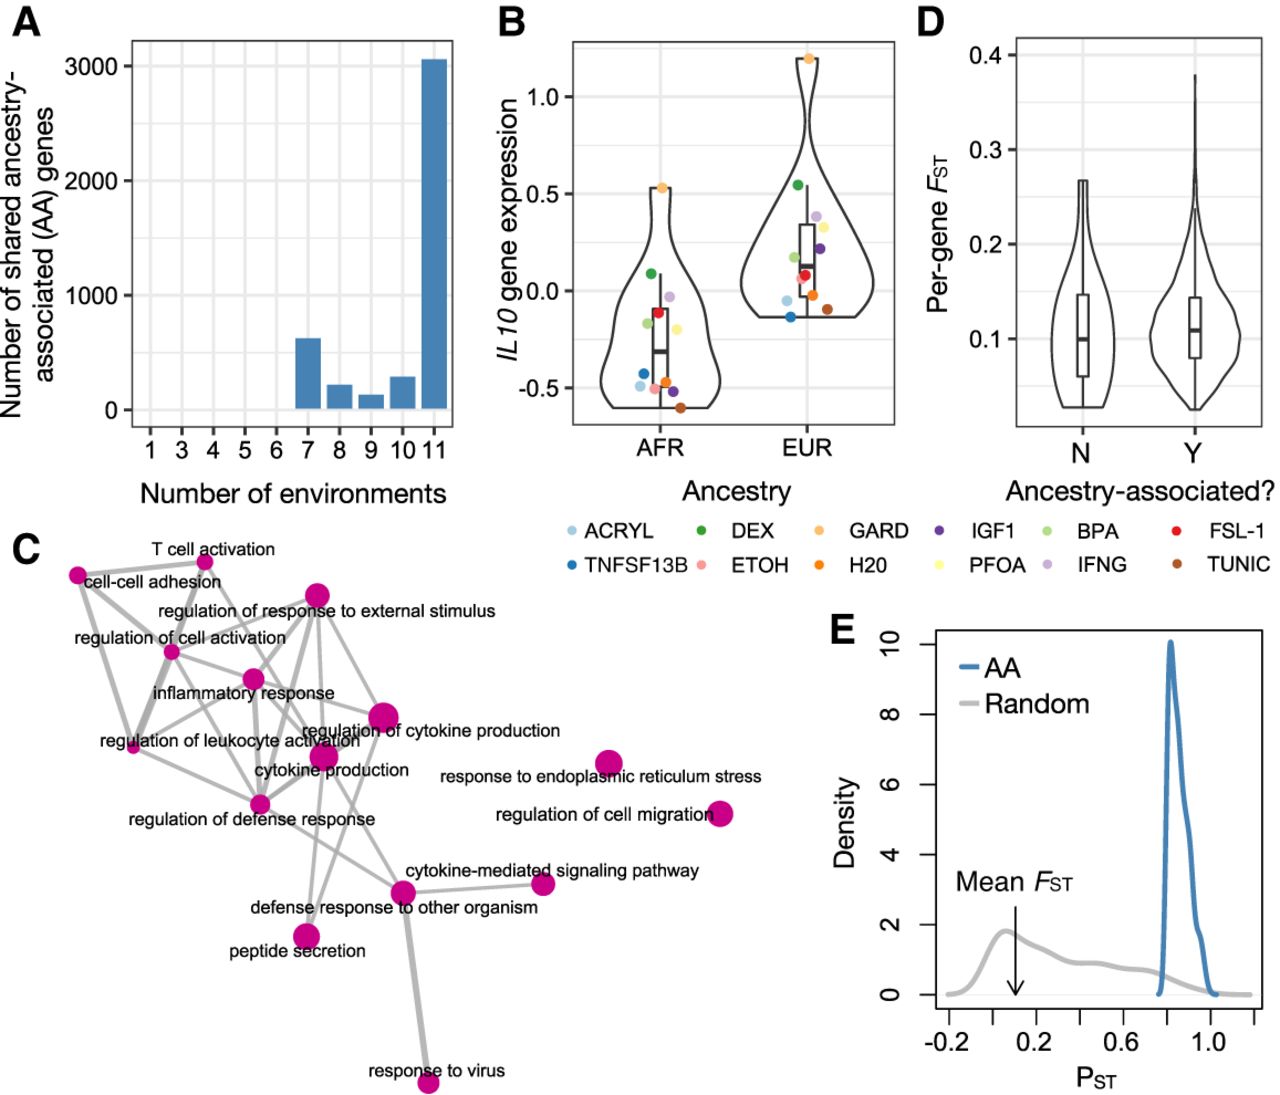
Ancestry effects on gene expression. (A) Number of ancestry-associated (AA) genes shared between N environments using a mashR, a joint analysis approach. N is plotted on the x-axis and ranges from one (i.e., the gene is AA in only one cellular environment) to 12 (i.e., the gene is AA in all 12 cellular environments). (B) Example of an AA gene. The y-axis shows the mean, normalized IL10 gene expression levels estimated in each environment, after regressing out three surrogate variables. (C) Results from gene set enrichment analyses testing for overrepresentation of particular Gene Ontology categories among AA genes (note that genes were sorted by average AA effect size across all 12 cellular environments, and only the top 15 most significant categories are shown). Enrichment map was created with the emapplot function in the R package enrichplot. (D) Distribution of average per-gene FST values for genes that (1) were found to be AA in most (more than two of three) cellular environments or (2) had no effects on ancestry in any cellular environment (results are from a mashR, a joint analysis approach). (E) Phenotypic differentiation (in gene expression; PST) versus genetic differentiation (FST) for AFR versus EUR samples. Plots show the distribution of PST values for (1) AA genes identified in the H2O cellular environment (blue) and (2) a same-sized set of randomly selected genes (gray). The mean genome-wide FST value comparing genetic divergence between AFR and EUR samples is noted on the x-axis with an arrow. We find that all AA genes show PST > FST, indicative of diversifying selection (Lamy et al. 2012; Leinonen et al. 2013). In this panel, we show the H2O environment as a representative example: The results are similar across all 12 environments, and these results are shown in Supplemental Figure S3.


