
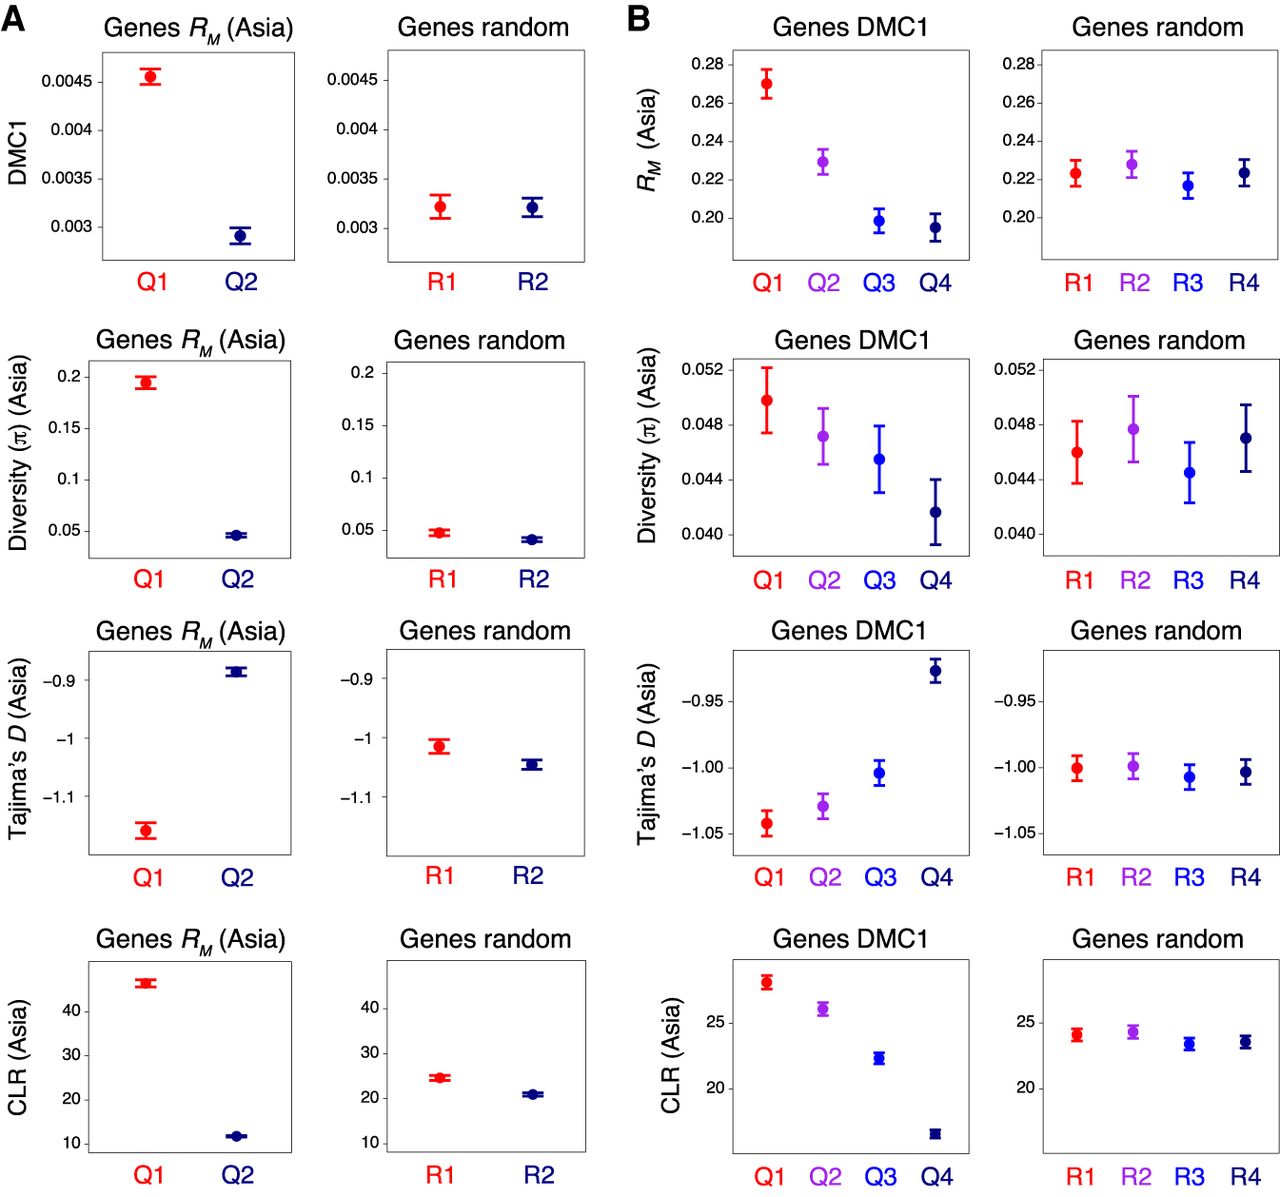
Historical recombination, DMC1, nucleotide diversity, and signatures of selection within genes. (A) Genes were divided into two groups corresponding to those in the 100th–50th (Quantile 1) and 50th–0th (Quantile 2) percentiles with regard to RM divided by gene width (Q1–Q2, left), or into two randomized groups (R1–R2, right). RM is the minimum number of crossovers that occurred in the history of a population of 91 hexaploid wheat accessions sampled from Central, East, and South Asia, inferred from genotypes at exome-sequencing-derived SNPs (He et al. 2019). Solid circles denote the mean value of the indicated parameter for each group of genes (error bars = 95% confidence intervals for mean values). Nucleotide diversity (the mean number of intrapopulation pairwise nucleotide differences per gene, π) was divided by gene width. Per-gene Tajima's D and composite likelihood ratios (CLRs) were also calculated. (B) As in A, but with genes divided into four groups according to decreasing mean DMC1 log2(ChIP/input) coverage (Q1–Q4, left), or into four randomized groups (R1–R4, right).


