
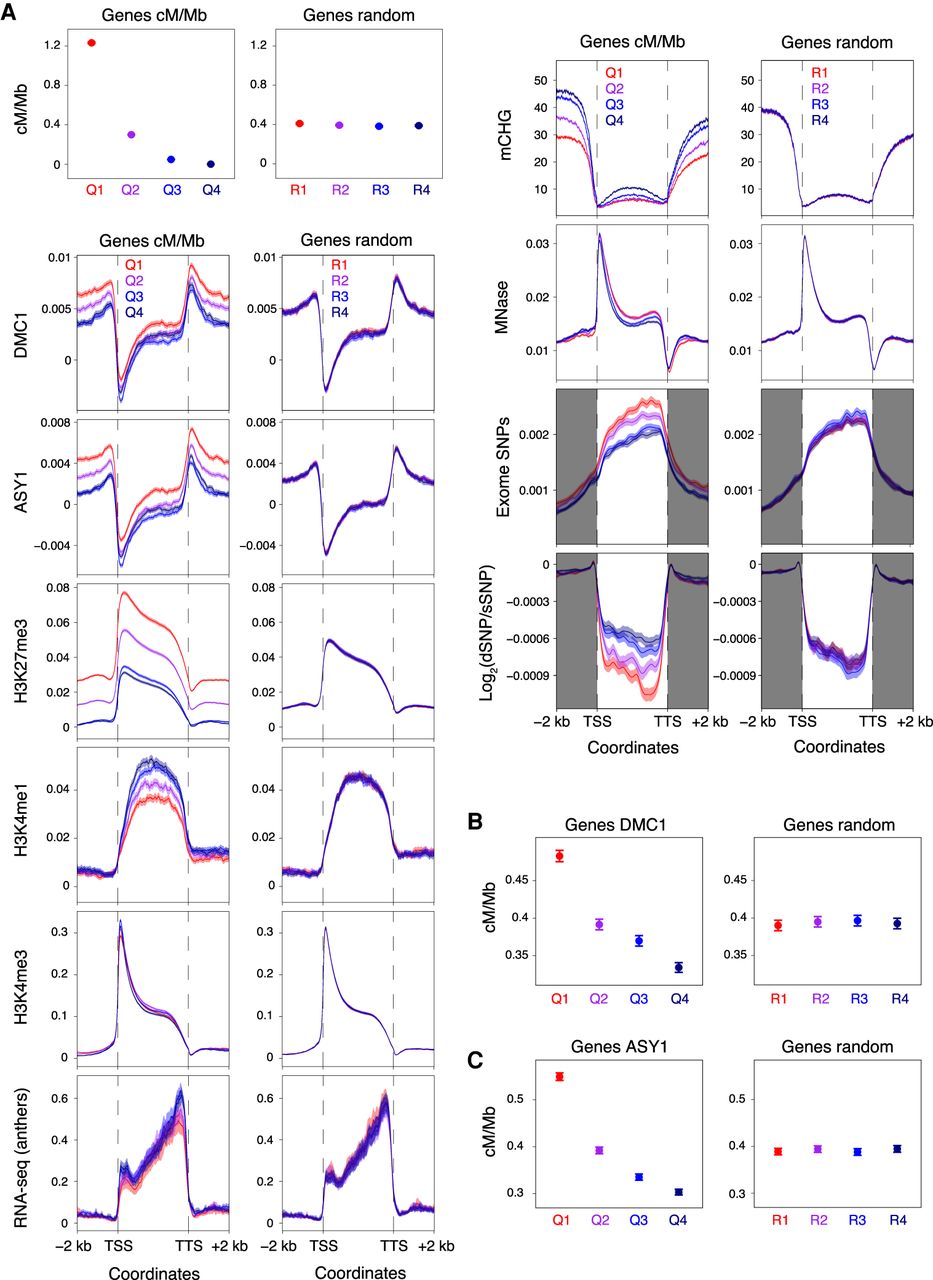
Patterns of genic recombination, chromatin, transcription, and polymorphism. (A) Genes were divided into four groups corresponding to those in the 100th–75th (Quantile 1), 75th–50th (Quantile 2), 50th–25th (Quantile 3), and 25th–0th (Quantile 4) percentiles with regard to their mean crossover rate (cM/Mb, derived from the Chinese Spring × Renan genetic map) between 1 kb upstream of transcriptional start sites (TSSs) and 1 kb downstream from transcriptional termination sites (TTSs) (Q1–Q4, left), or into four randomized groups (R1–R4, right). Solid circles denote the mean crossover rate for each group of genes (error bars = 95% confidence intervals for mean cM/Mb values). Metaprofiles show windowed mean values (solid lines) for each group of genes and 2-kb flanking regions (transparent ribbons = 95% confidence intervals). ChIP-seq coverage metaprofiles of DMC1, ASY1, H3K27me3 (IWGSC 2018), and H3K4me1 (Li et al. 2019) are derived from log2(ChIP/input) profiles, and those for H3K4me3 from log2(ChIP/MNase) profiles. Metaprofiles of RNA-seq coverage (transcripts per million, TPM) are derived from Chinese Spring anthers collected at the leptotene–zygotene transition (Martín et al. 2018). CHG-context DNA methylation (mCHG) metaprofiles are based on the proportion of cytosines that are methylated per CHG site, as detected in whole-genome bisulfite sequencing data (IWGSC 2018). Metaprofiles of exome-sequencing-derived SNPs are based on windowed SNP frequencies (He et al. 2019). Although the vast majority of SNPs detected using exome sequencing are located within gene bodies, these data also provide genotypes outside of transcribed regions. Therefore, SNPs outside of transcribed regions were retained for metaprofile calculation (gray shading). Windowed ratios of predicted deleterious SNPs to synonymous SNPs (log2[dSNP/sSNP]) were also used for metaprofile calculation. (B) Genes were divided into four quantiles according to decreasing mean DMC1 log2(ChIP/input) coverage between 1 kb upstream of TSSs and 1 kb downstream from TTSs (Q1–Q4, left), or into four randomized groups (R1–R4, right). Solid circles denote the mean crossover rate for each group of genes (error bars = 95% confidence intervals for mean cM/Mb values). (C) As in B, but with genes divided into four groups according to decreasing mean ASY1 log2(ChIP/input) coverage (Q1–Q4, left), or into four randomized groups (R1–R4, right).


