
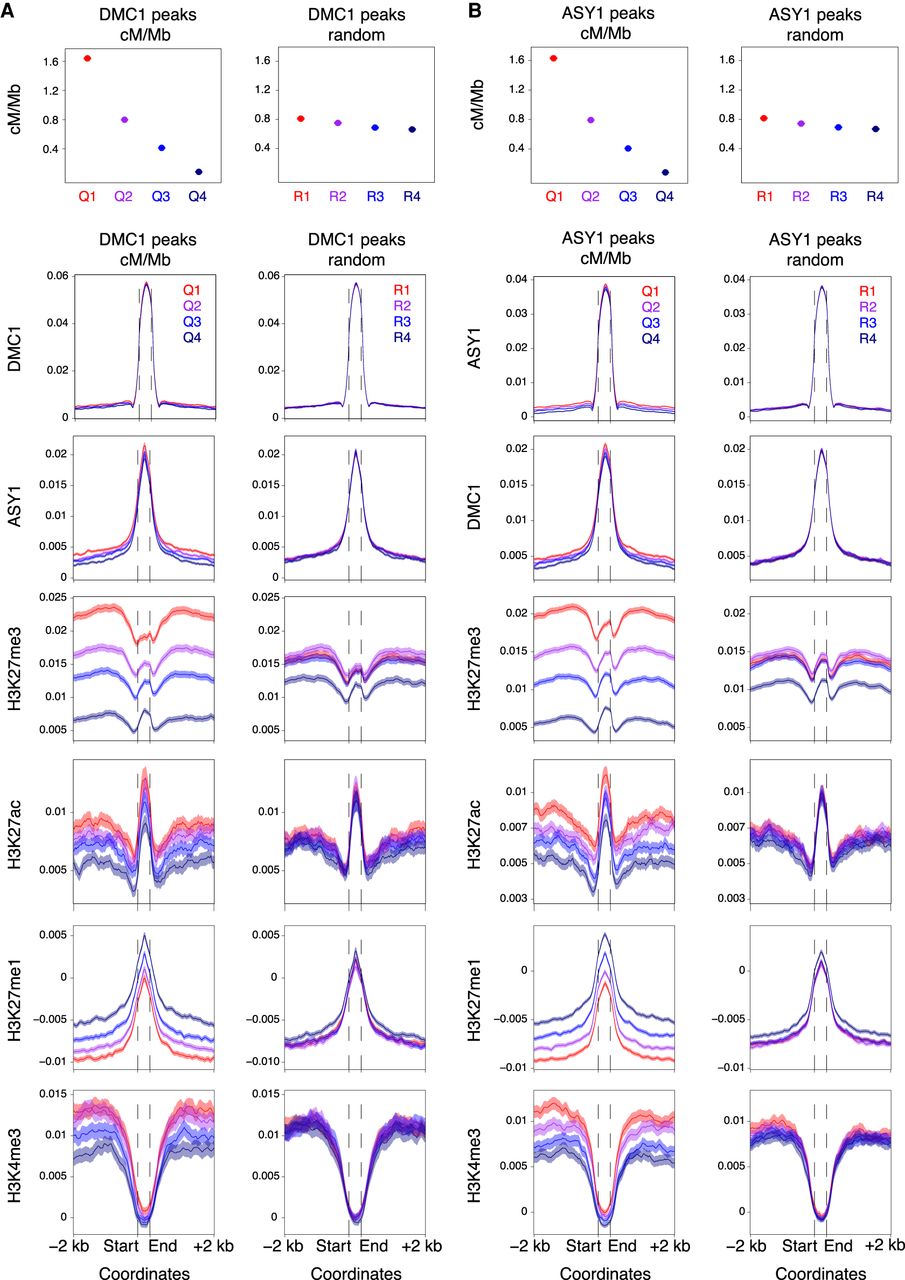
High-crossover-rate DMC1 and ASY1 ChIP-seq peaks are enriched for the Polycomb chromatin mark H3K27me3. (A) Distally located (R1 and R3) DMC1 ChIP-seq peaks were divided into four groups corresponding to those in the 100th–75th (Quantile 1), 75th–50th (Quantile 2), 50th–25th (Quantile 3), and 25th–0th (Quantile 4) percentiles with regard to their mean crossover rate (cM/Mb, derived from the Chinese Spring × Renan genetic map) between 1 kb upstream of peak start coordinates and 1 kb downstream from peak end coordinates (Q1–Q4, left), or into four randomized groups (R1–R4, right). Solid circles denote the mean crossover rate for each group of peaks (error bars = 95% confidence intervals for mean cM/Mb values). Metaprofiles show windowed mean values (solid lines) for each group of peaks and 2-kb flanking regions (transparent ribbons = 95% confidence intervals). ChIP-seq coverage metaprofiles of DMC1, ASY1, H3K27me3 (IWGSC 2018), and H3K27ac (Li et al. 2019) are derived from log2(ChIP/input) profiles, and those for H3K27me1 and H3K4me3 from log2(ChIP/MNase) profiles. (B) As in A, but for distal ASY1 ChIP-seq peaks.


