
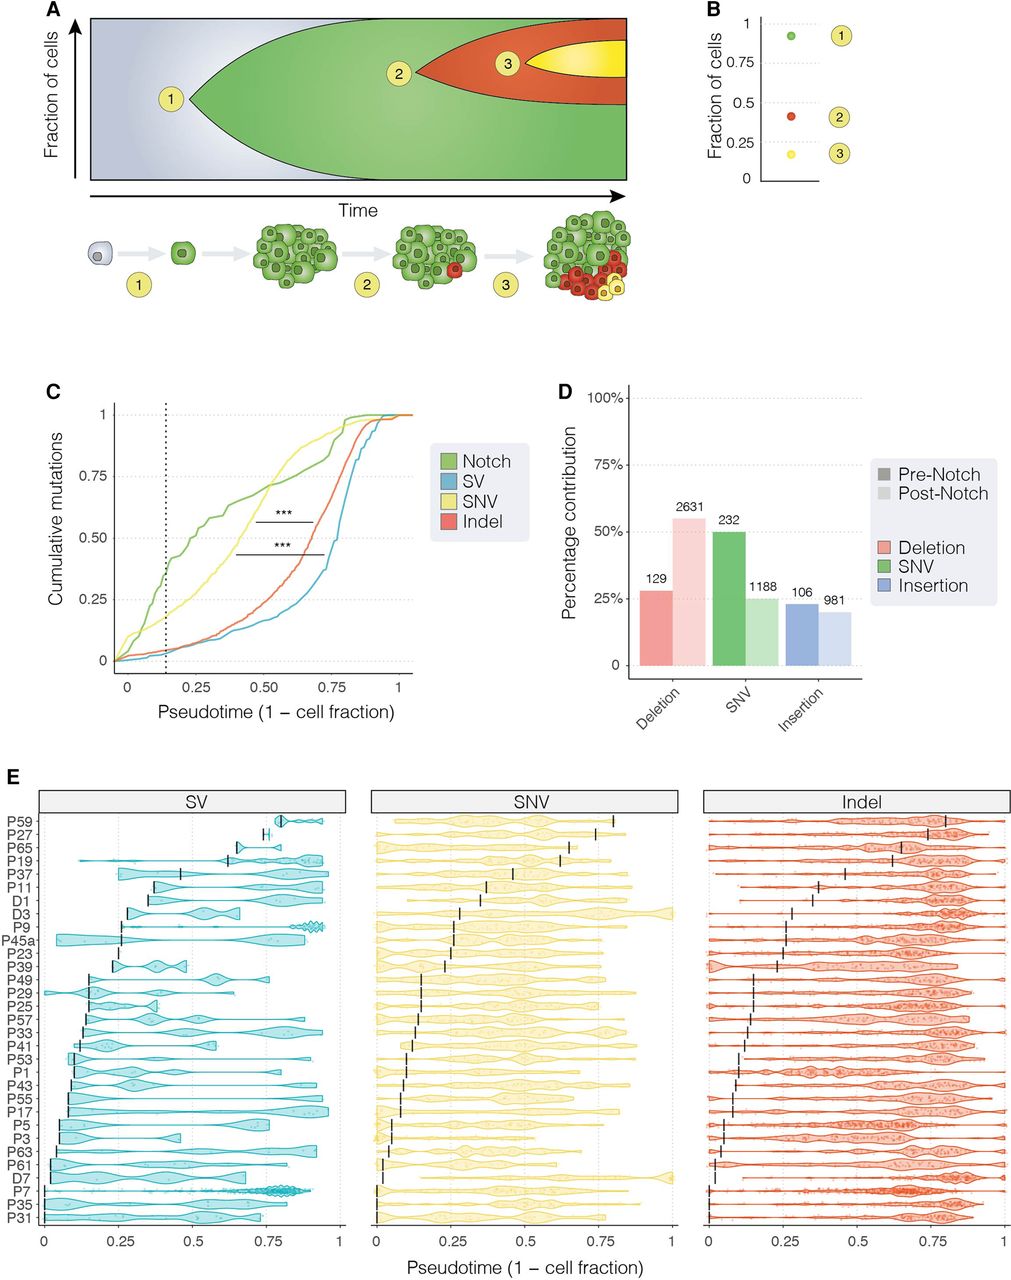
The evolution of somatic mutational in ISC genomes. (A) A schematic illustrating the accumulation of mutations in a stem cell and clonal neoplasm over time. At time point 1, an ISC acquires a somatic mutation that inactivates Notch, driving hyperproliferation of Notch− cells (in green). At time points 2 and 3, subsequent mutations are acquired (shown in red and yellow) that are present in smaller numbers of cells. (B) A modified VAF (Methods) can be used to estimate the fraction of cells carrying each mutation that we use as a proxy for time (pseudotime). (C) The cumulative distribution of mutations (aggregated over all samples) over pseudotime shows that mutations in Notch occurred before other classes of mutation. SNVs arose before other mutations and had a significantly different distribution to both indels and non-Notch SVs (P < 0.001; Kolmogorov–Smirnov test). The median pseudotime value for Notch-inactivating events is shown as a dotted vertical line. (D) For each sample, VAF values of Notch-inactivating mutations were used to divide point mutations observed genome-wide as occurring before Notch (darker shaded bars) and post Notch (lighter shaded bars). Numbers on top of each bar show the number of mutations observed in each category. (E) Per-sample estimates of tumor evolution. Notch-inactivating events for each sample are shown as vertical black bars. Each dot represents a single mutation, and violin plots ease the visualization of mutation distribution over pseudotime. Asterisks in C denote significance: (***) P < 0.001.


