
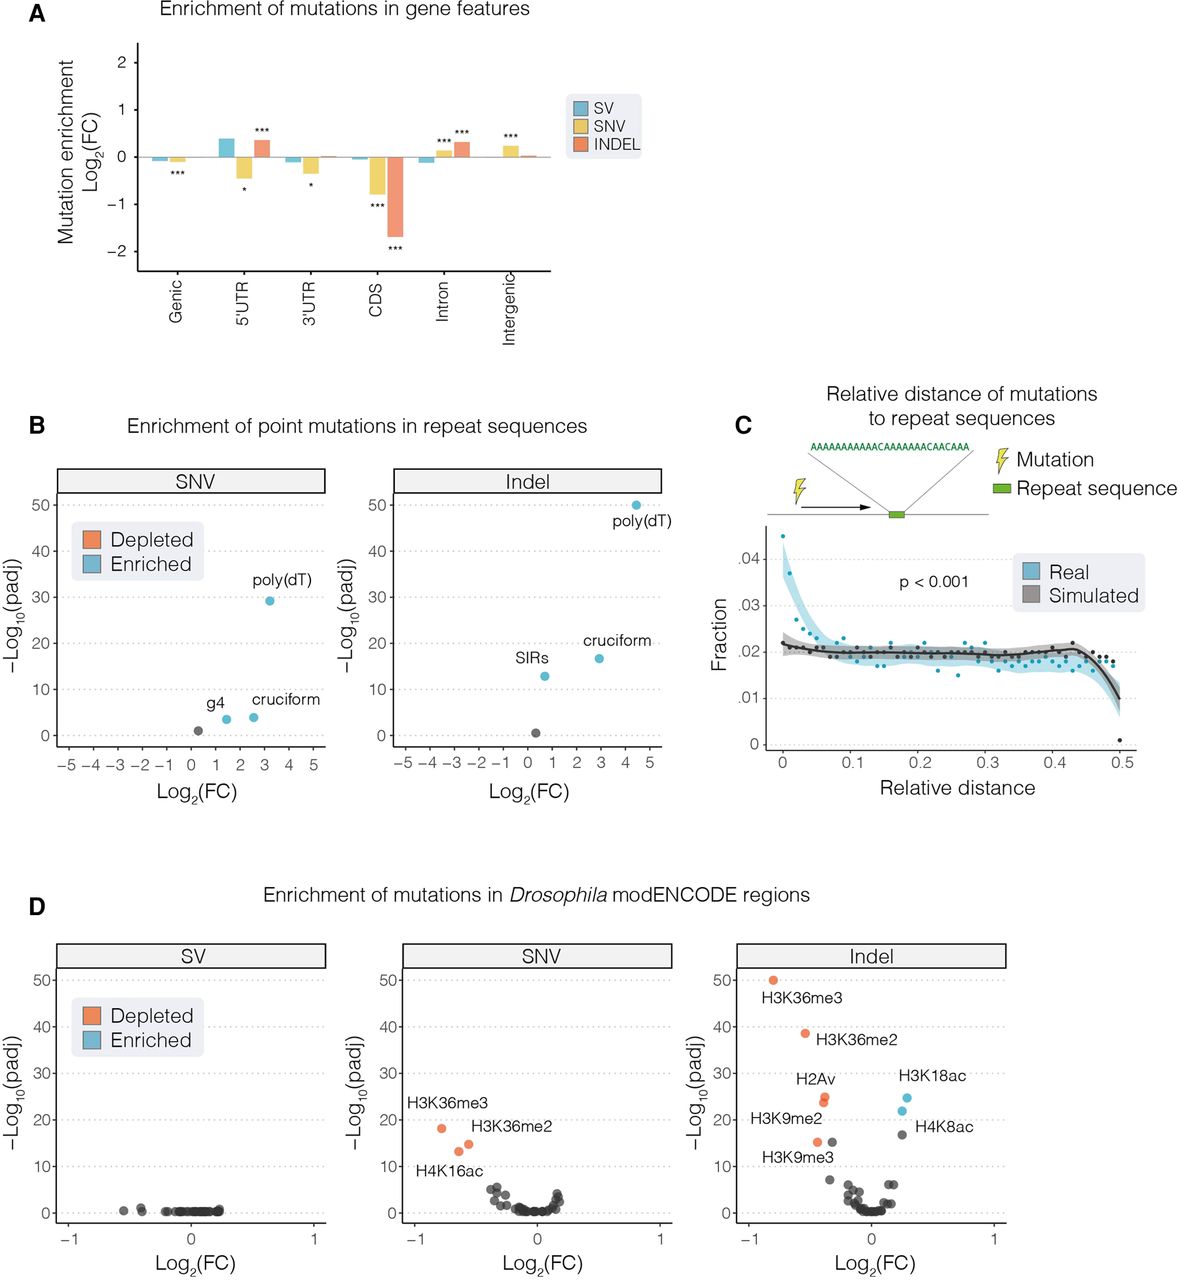
Distribution of somatic mutations in genome features. (A,B,D) The Log2 FC enrichment of mutations in genomic features. In each case, we compared the number of mutations in a given feature with the number expected given the feature's size. (A) Point mutations (SNVs and indels) were both strongly depleted in CDS regions. (B,D) Volcano plots showing enrichment or depletion of mutations in repeat regions (B) and chromatin features from the Drosophila modENCODE data set (D). Highlighted features represent those that with an E-score (−Log10(p) × Log2(FC); Methods) >5. (C) The distribution of relative distances between combined somatic mutations (breakpoints, SNVs, and indels; blue points) and the closest instance of repeat sequences in the genome. Simulated data are shown for comparison in gray. The y-axis of B and D are restricted to a maximum −Log10(padj) value of 50. Asterisks denote significance: (***) P < 0.001, (*) P < 0.5. All P-values shown have been generated from a two-sided binomial test and adjusted for multiple comparisons using a Benjamini–Hochberg adjustment.


