
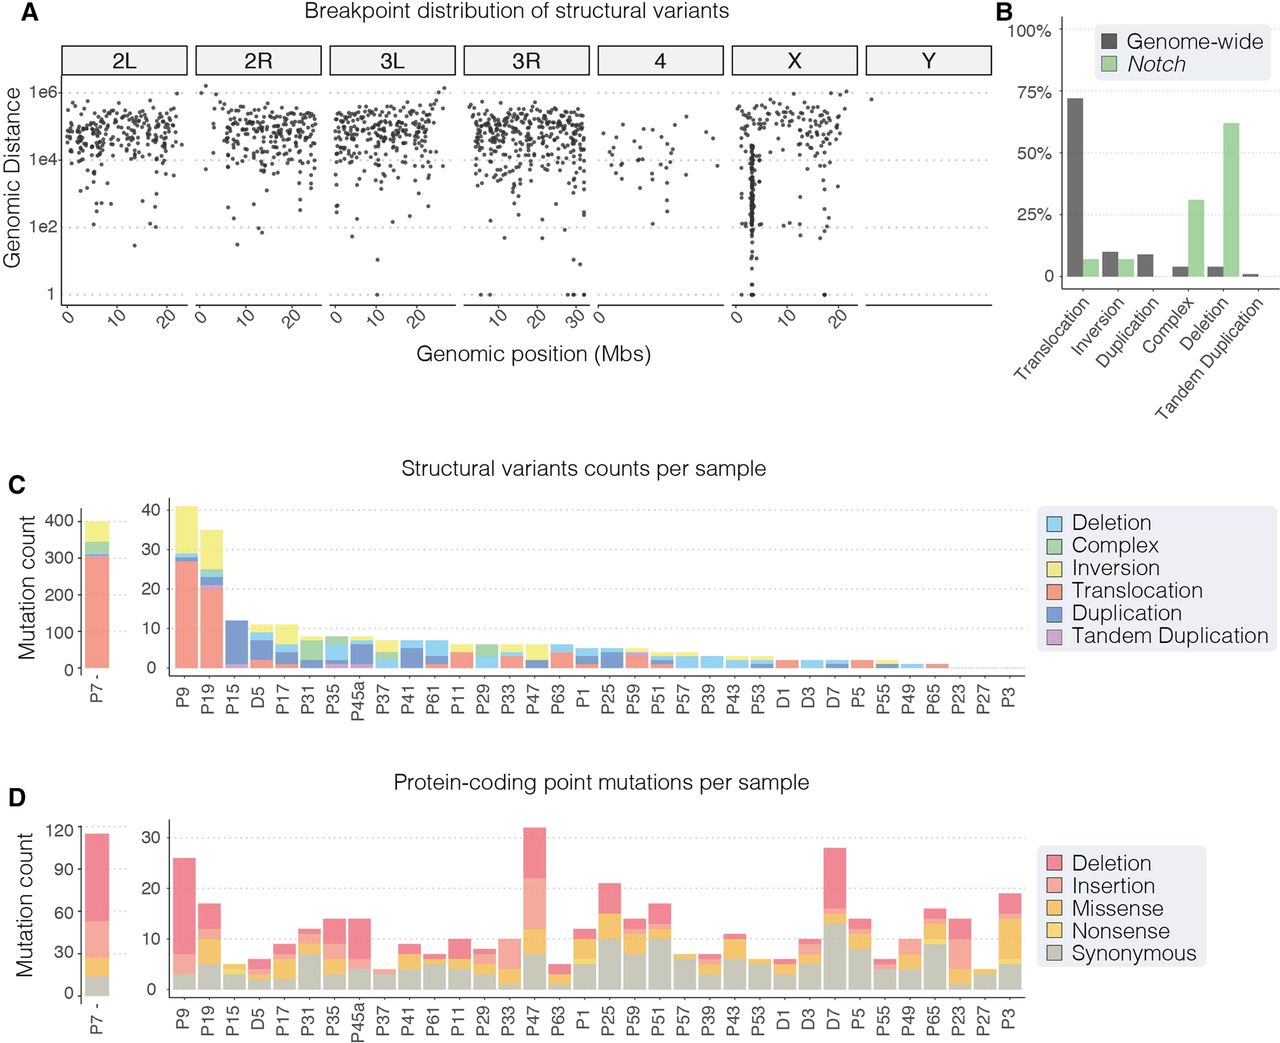
Figure 4.
Multiple classes of somatic mutations were detected genome-wide. (A) A rainfall plot showing the distances between structural variant breakpoints across the genome. The y-axis shows the Log10 distance between consecutive breakpoints, with lower numbers representing smaller distances between breakpoints. (B) The percentage contribution of different structural variant classes to the total number of mutations identified genome-wide (gray bars) and in Notch-inactivating variants (green bars). (C,D) The number of each class of structural variant (C) and protein-coding point mutation (D; SNVs and indels) observed across samples. In both C and D, sample P7 is plotted on a separate axis to aid visualization.


