
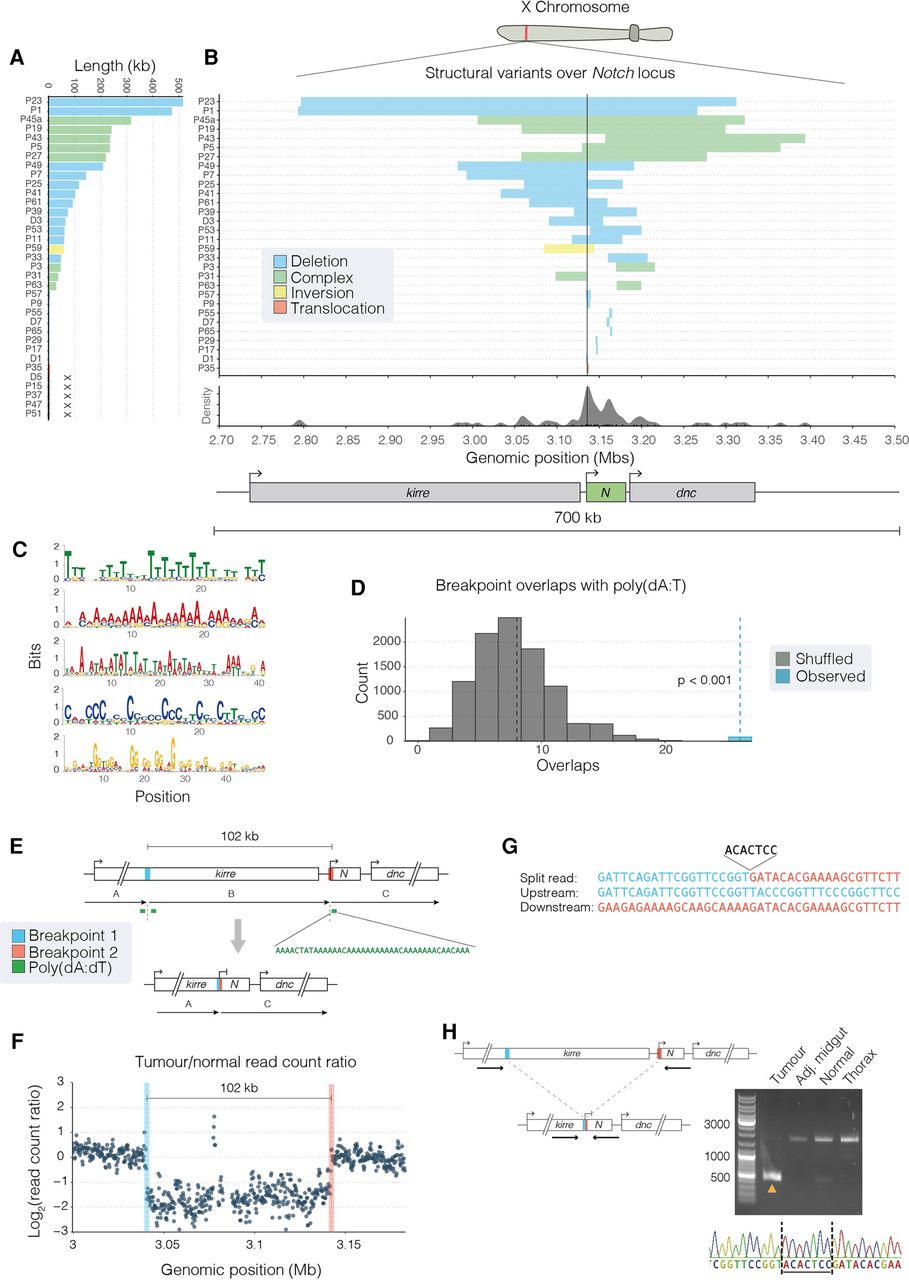
Notch is inactivated by multiple different mutational events. (A) Structural variants affecting Notch in each sample vary in size and class. Across all samples, we found Notch to be inactivated by deletions (20/35; blue), complex rearrangements (8/35; green), an inversion (1/35, sample P59; yellow), and one translocation (1/35, sample P35; red). In five samples (marked as “X”), we did not detect a structural variant in Notch. (B) Breakpoints were plotted over the Notch locus, and we observed a clustering around the TSS, indicated by a black vertical line. (C) Position-weight matrices showing highly repetitive motifs found enriched ±500 bp of Notch breakpoint. (D) Permutation tests showed that breakpoint flanking sequences were significantly enriched (P < 0.001) for poly(dA:dT) sequences. We observed 25 overlaps between breakpoint flanking sequences and poly(dA:dT) sequences (blue dashed line), and in 10,000 permutations, we detected a median of seven overlaps (black dashed line). (E) A schematic for the 102-kb Notch-inactivating deletion in sample P41, showing genomic regions before (top) and after (bottom) the rearrangement. Colored boxes represent breakpoints, with the resulting genomic adjacencies shown below. We detected poly(dA:dT) sequences within 250 bp of both breakpoints. (F) Read-depth ratio plot over the deleted region. Each point represents the Log2 ratio of read counts in 500-bp windows between the tumor and normal sample. Breakpoints are additionally indicated by dotted lines in both E and F. (G) Nucleotide sequences of breakpoint junctions detected in split-reads, with the upstream and downstream genomic sequences shown. Colors correspond to the breakpoints shown in E and F, and a short insertion is shown above in gray. (H) PCR validation of the Notch variant shown in E and F. Primers upstream of and downstream from the deletion were used to amplify the breakpoint. The orange arrowhead indicates the expected 470-bp amplicon detected in the tumor DNA but not in the controls isolated from the same fly: adjacent midgut, head (normal), or thorax DNA. The amplicon was sequenced (chromatogram). Black dashed lines indicate breakpoints, and underlined bases constitute a 7-bp breakpoint insertion.


