
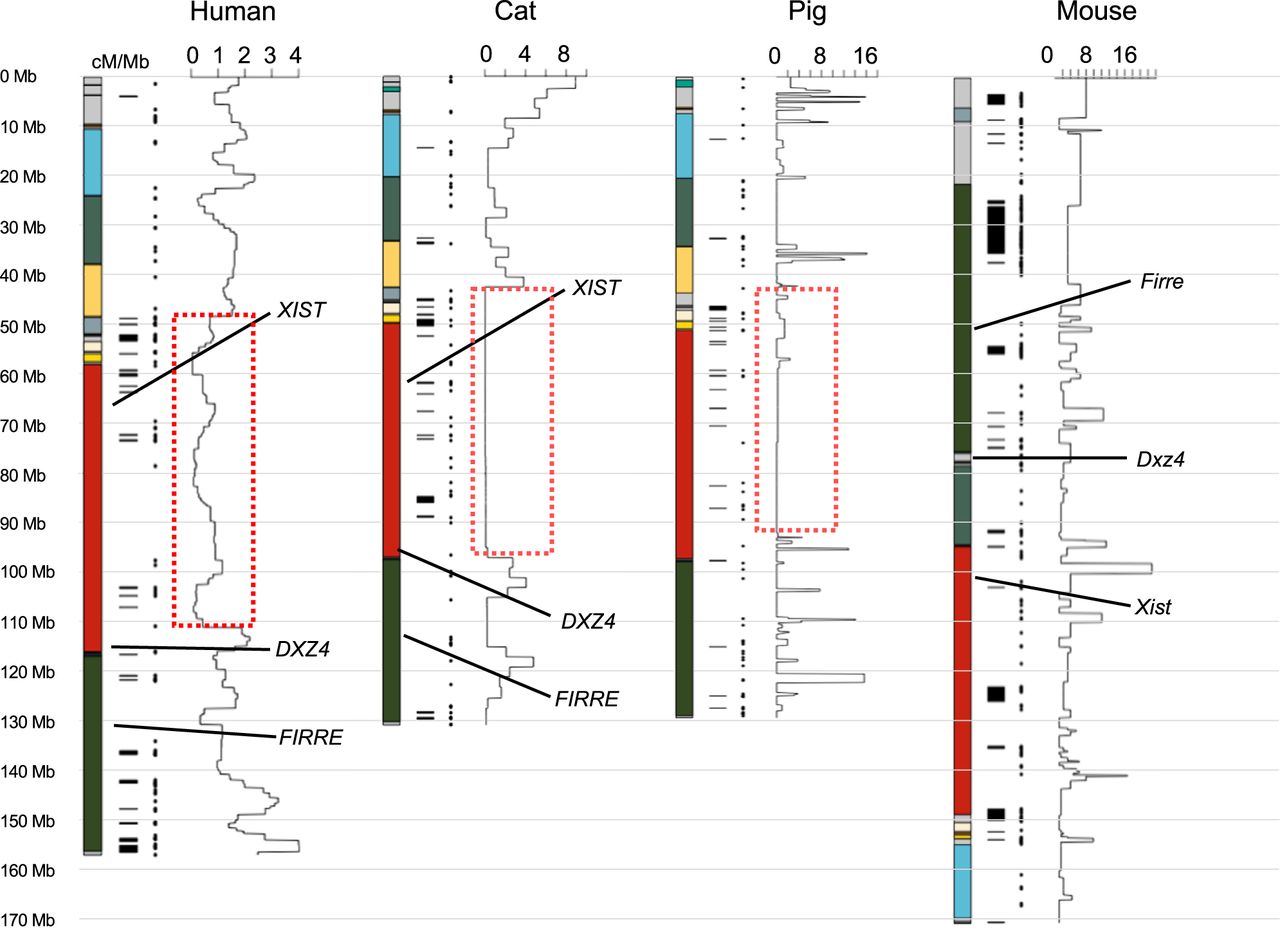
Figure 4.
Interspecific comparison of four mammalian X Chromosomes. Ideograms of the human, cat, pig, and mouse X Chromosomes with areas of conserved synteny shown in colored bands. For each X Chromosome, the ampliconic regions are shown to the right as black bars, and the locations of lineage-specific gene gains are to the right of these bars depicted as black dots. Regional rates of recombination are plotted along the length of each X Chromosome, and the shared recombination cold spot is outlined in the dashed red box for the human, domestic cat, and pig.


