
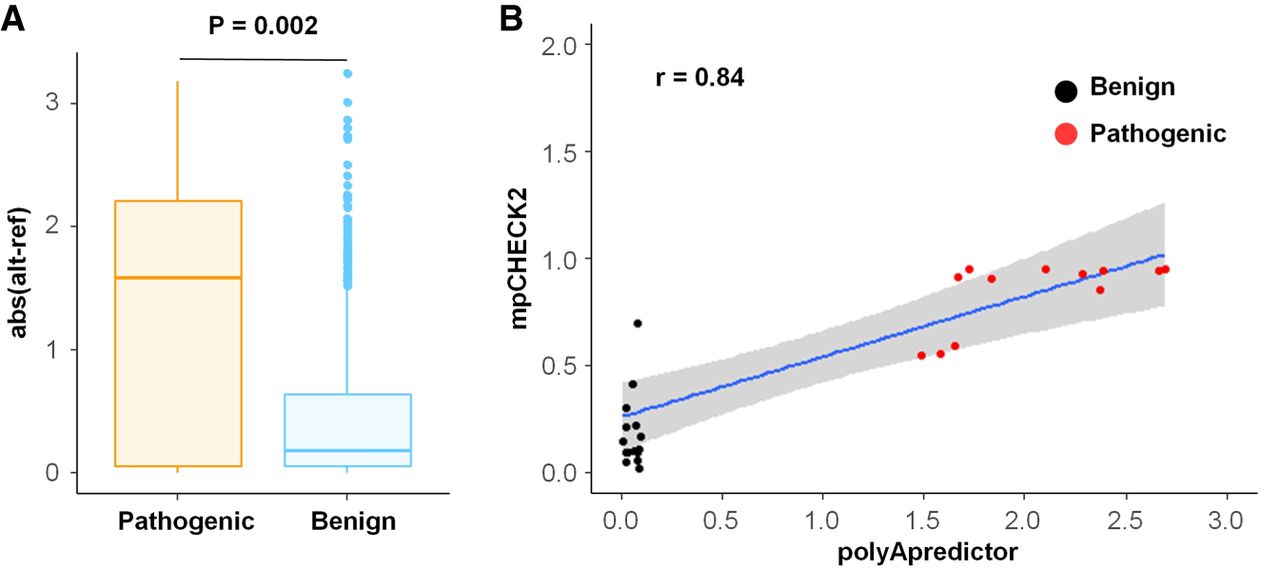
Comparison between our method and polyApredictor for evaluating the effect of PAS variants on RNA-level gene expression. (A) Box plot of predicted expression changes between database-annotated pathogenic (left) and benign (right) variants in the PAS using polyApredictor. Abs (alt-ref) denotes absolute value reported by polyApredictor when comparing mutated to reference sequence of the PAS. (B) Scatterplot for evaluating the correlation of the analytic results reported between mpCHECK2 and polyApredictor. x-axis denotes the difference value (reported by polyApredictor) between mutated and reference base inside PASs. y-axis denotes the degree of normalized luciferase activity changes (reported by mpCHECK2) between mutated and reference base inside PASs. Each dot denotes a PAS variant. Red and black dots denote pathogenic and benign variants in PASs, respectively. Blue line shows the fitting of linear regression trend, and gray region denotes 95% confidence interval (CI). Pearson correlation coefficient (r = 0.84) is shown on the top left.


