
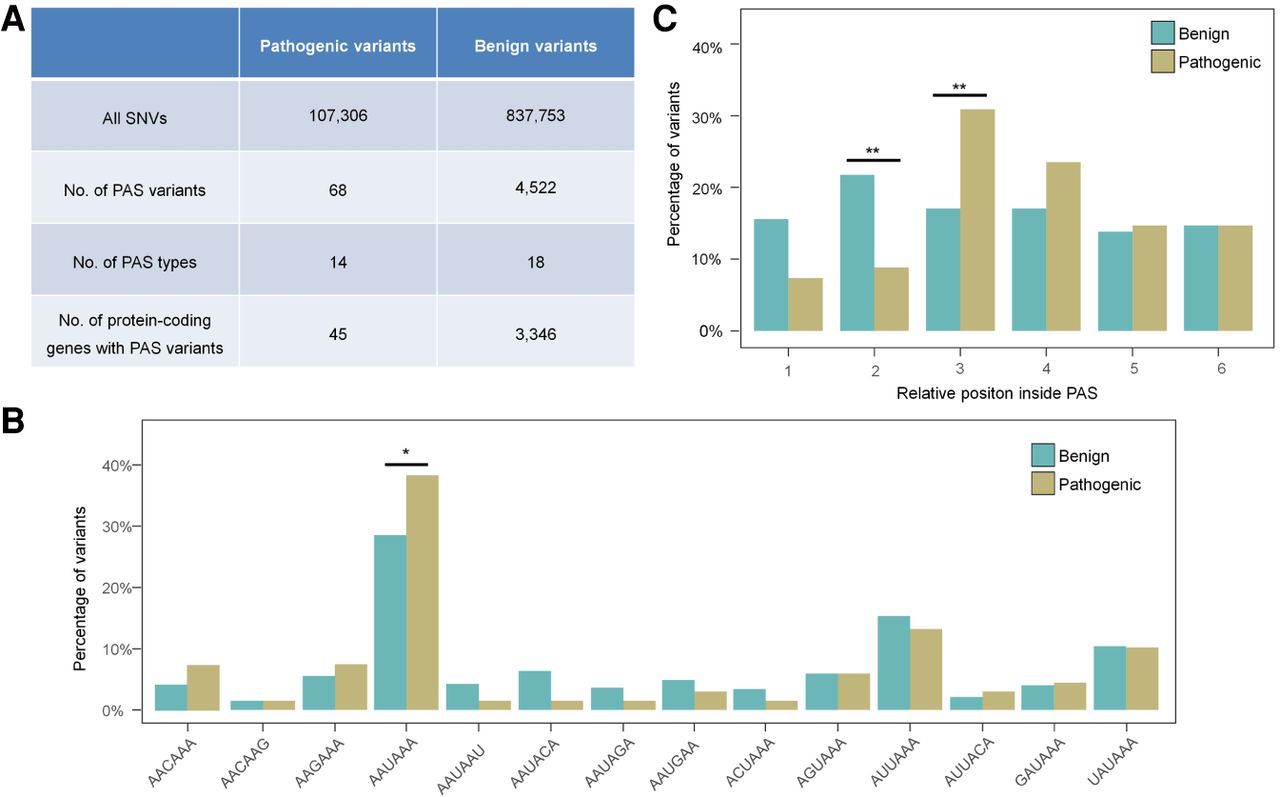
Figure 3.
Distinct features of PAS-located pathogenic variants and their associations with human diseases. (A) Classification of disease-associated variants located in the PASs. (B) The distribution difference between pathogenic and benign variants in the 13 shared PASs. (C) The position preferences between pathogenic and benign variants in the PAS. The x-axis denotes six positions (1–6) of the PAS. (*) P < 0.05, (**) P < 0.01, Fisher's exact test.


