
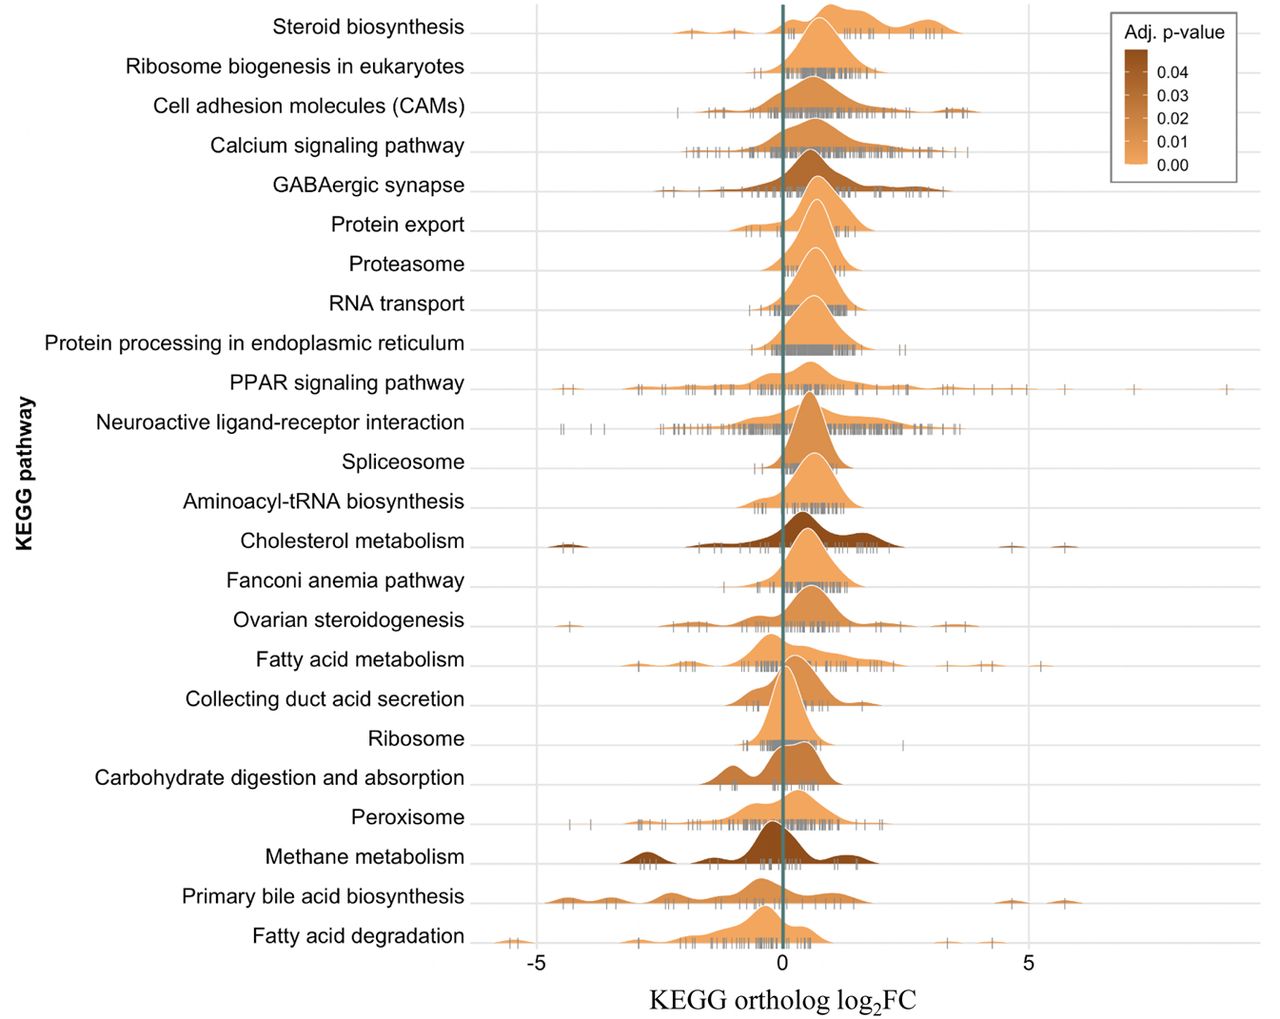
Figure 2.
Significant pathways identified from RNA-seq data of double-crested cormorant (DCCO). The pathways are visualized by ridgeline plots. The distribution for each pathway is colored according to the pathway's adjusted P-value. The vertical gray lines indicate the log2FC values of all genes in the enriched pathways.


