
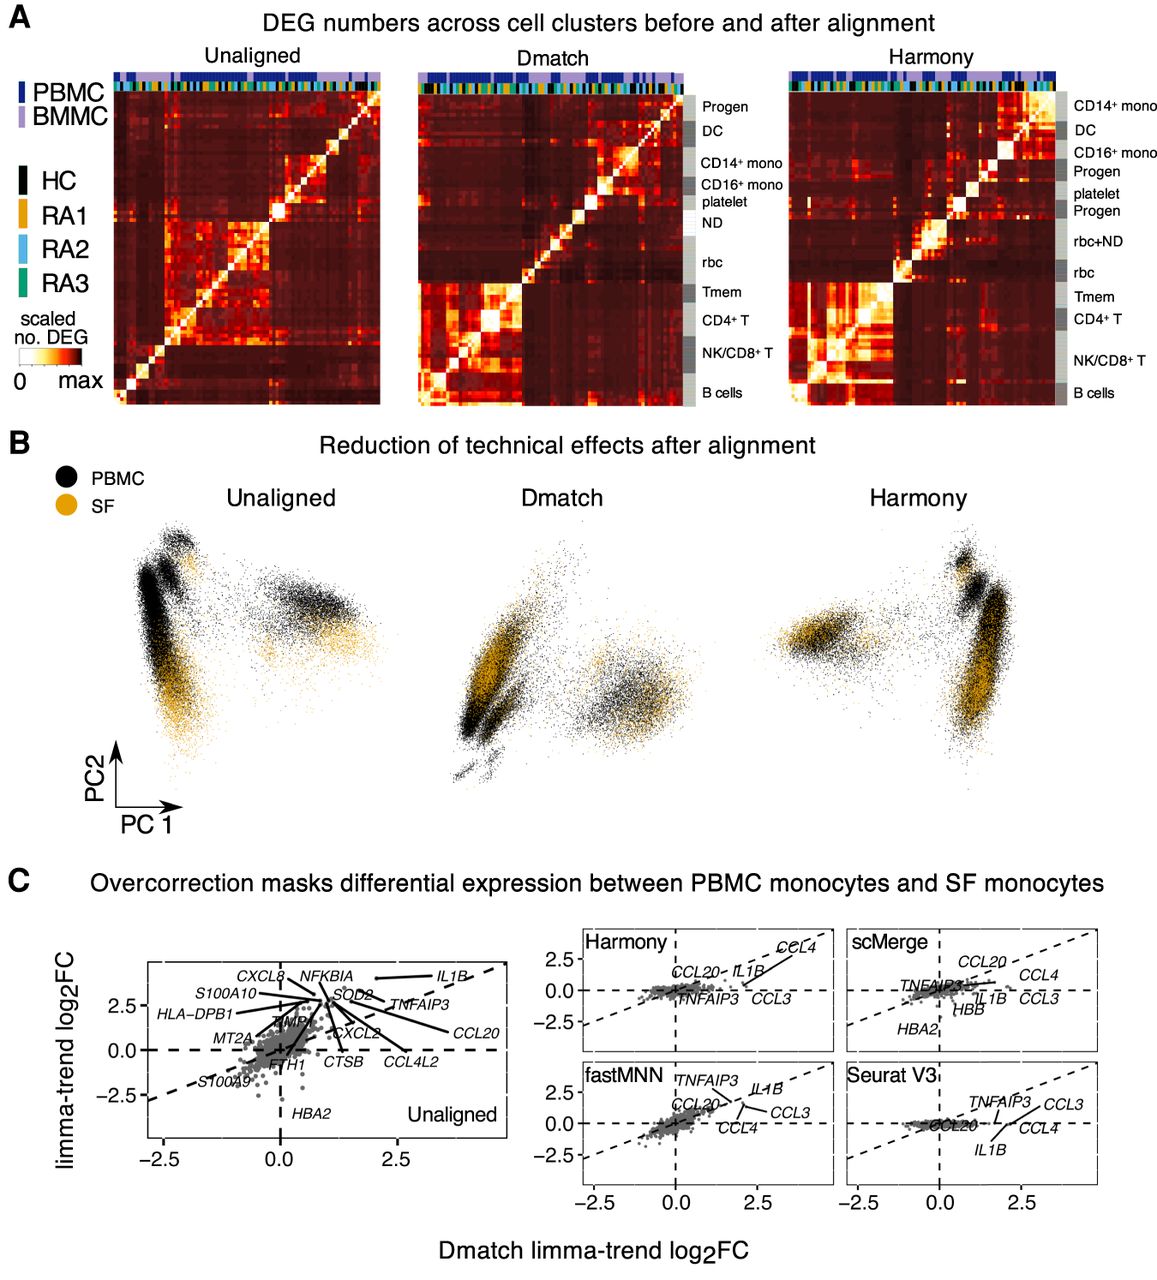
Cross-biopsy alignments between PBMC and SF immune cells. (A) Heat maps showing the number of DEGs identified (Methods) across Seurat clusters in PBMC and BMMC samples using unaligned data, Dmatch-aligned data, and Harmony-aligned data (others in Supplemental Fig. S12). Improvement of clustering by cell type using aligned data indicates removal of batch effects from unaligned data. (ND) Not determined. (B) PCA of scRNA-seq samples from PBMC and SF before alignment and after alignment using Dmatch and Harmony. Although unaligned data show likely batch effects specific to biopsy site, this effect is reduced after alignment. (C) Scatterplots of estimated gene expression log fold changes between CD14+ monocytes from RA2 PBMC and RA2 synovial fluid (SF). We found that only Dmatch- and fastMNN-aligned data reflected overexpression of pro-inflammatory genes in RA2 SF versus PBMC monocytes.


