
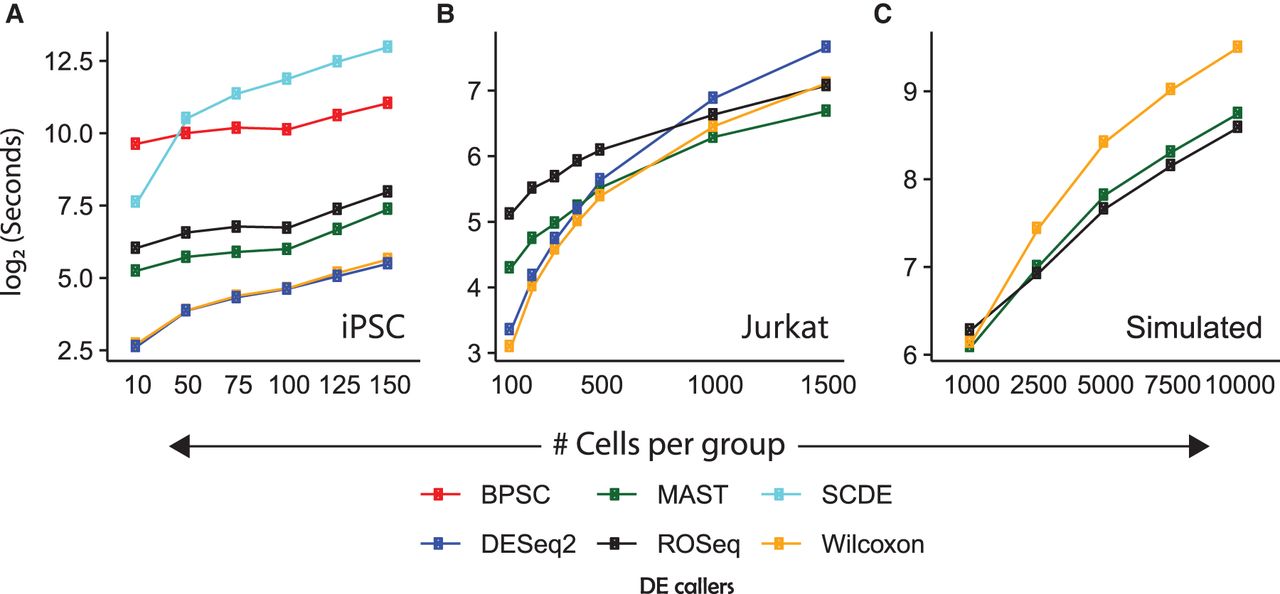
Figure 5.
Tracking execution time on scRNA-seq data of varied sizes. (A) Line chart showing median time taken by each algorithm on 100 randomly sampled null data sets containing iPSC transcriptomes (replicate id: NA19098). (B) Line chart showing median time taken by each algorithm on 20 randomly sampled null data sets containing Jurkat transcriptomes. (C) Line chart showing median time taken by each algorithm on 20 randomly sampled null data sets using the Splatter R package (Zappia et al. 2017). Note that for the iPSC data, we used a single CPU core; for the remaining larger data sets, we used four cores of the workstation.


