
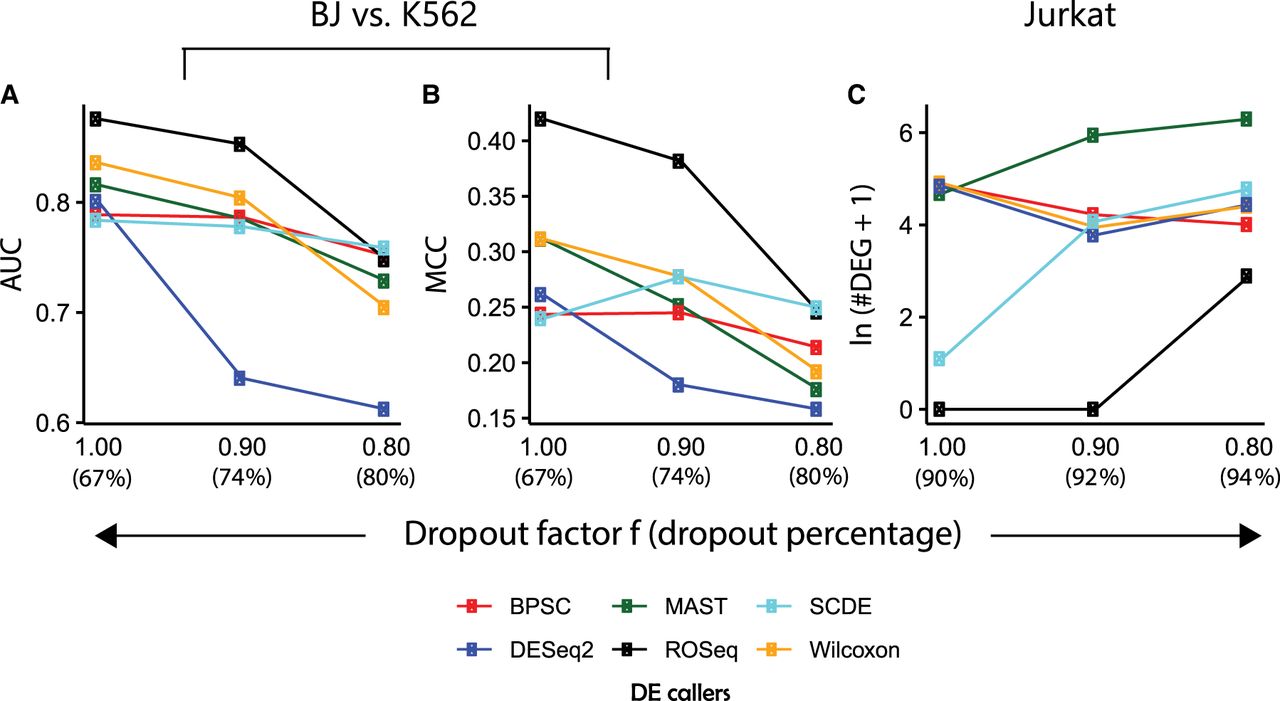
Figure 4.
Tolerance against expression dropouts. (A) Line chart showing decline in AUC with the increase in dropout levels. Performance was recorded on the Gupta data set comprising BJ fibroblasts and K562 cells. (B) Line chart showing MCC values that largely mirror AUC values in subfigure A. (C) Line chart showing the trend of increased false DEG calls with the increase in dropout levels. Null data sets were created using Jurkat cell transcriptomes from the Zheng data set. Each of the contrasting groups contains 1000 cells.


