
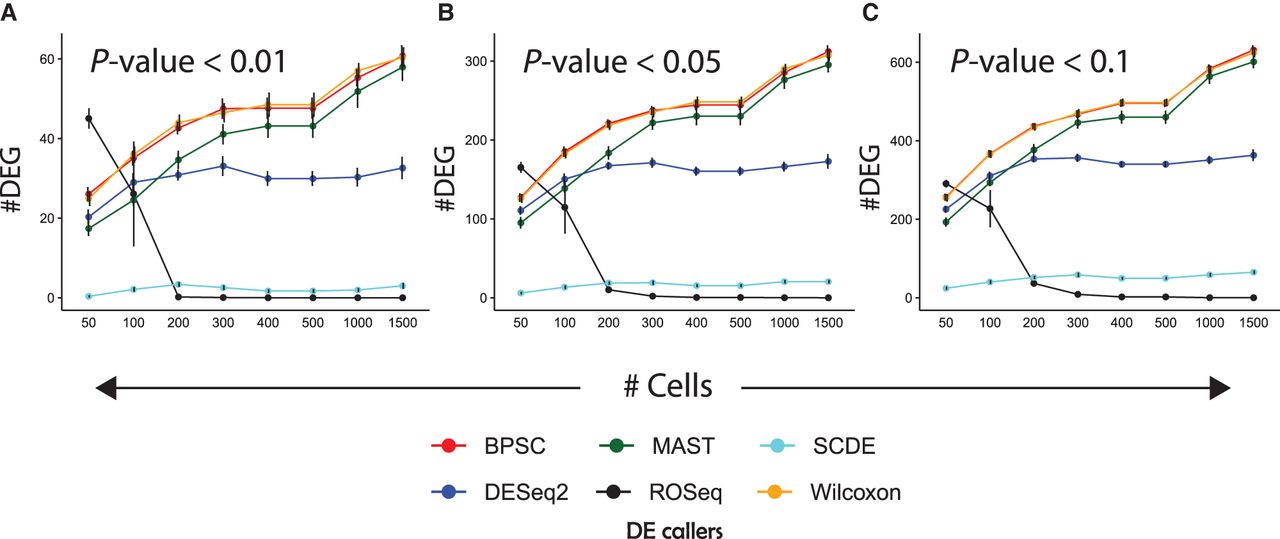
Figure 3.
Type I error rates. (A) Line chart showing Type I error rates with SE (depicted by error bars), obtained by applying different DEG callers on 20 randomly sampled null data sets, for varied cell-group sizes. We applied a P-value cutoff of 0.01. These experiments were performed using Jurkat transcriptomes (approximately 3200 cells and approximately 32,000 transcripts) (Zheng et al. 2017). (B,C) Similar plots with P-value cutoff of 0.05 and 0.1, respectively.


