
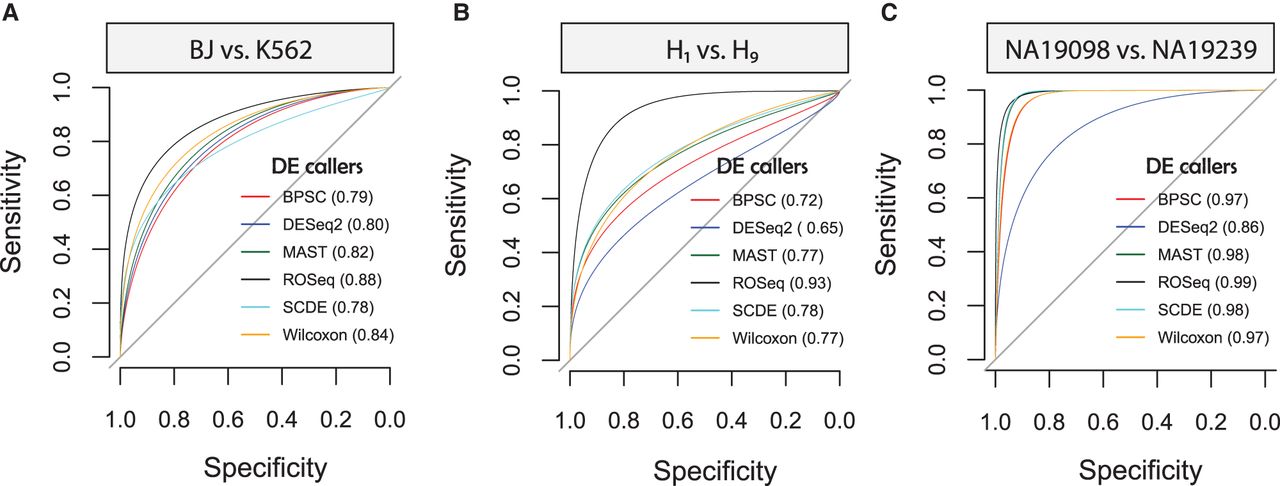
Figure 2.
Benchmarking of single-cell DE call accuracy against DE genes detected at tissue levels. (A) ROC and the associated AUC values obtained by bulk-based benchmarking of single-cell DEG calls between BJ and K562 cells (Gupta data). (B) ROC plot for H1 and H9 cells (source: Chu data) (Chu et al. 2016). (C) ROC plot for NA19098 and NA19239 cells (source: Tung data) (Tung et al. 2017).


