
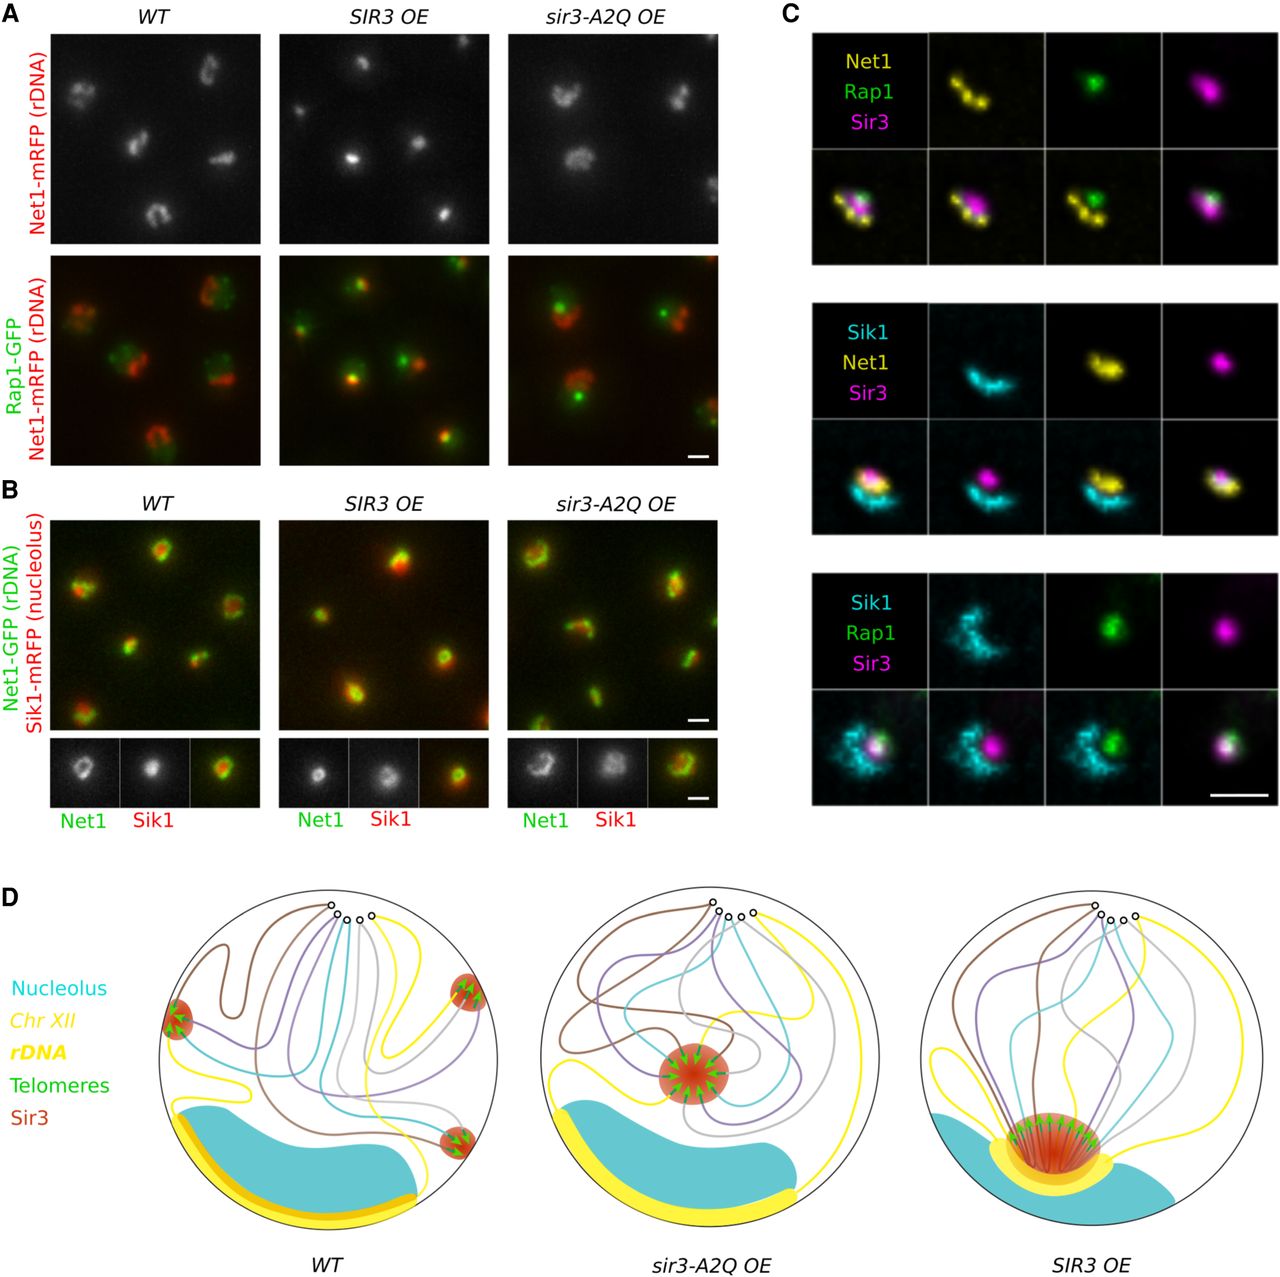
Sir3 overexpression impacts the rDNA spatial organization and its compaction. (A) Representative fluorescent images of Rap1-GFP/Net1-mRFP strains expressing either the endogenous level of Sir3 (yAT3729), high levels of Sir3 (yAT3730), or high levels of the Sir3-A2Q mutant (yAT3733). Cells were grown in CSM with 2% galactose and imaged after an overnight culture. (B) Representative fluorescent images of a double-tagged strain Net1-GFP/Sik1-mRFP in strains expressing the endogenous level of Sir3 (yAT1004), high levels of Sir3 (yAT1008), or high levels of the Sir3-A2Q mutant (yAT1541). Cells were grown in CSM 2% galactose and imaged after an overnight culture. In the bottom panels, close-up of selected nuclei from the field are shown (GFP-channel, RFP channel, and merge). (C) Representative fluorescent deconvolved images of triple-tagged strains, individual and merge channels are shown. Cells were grown overnight in CSM 2% glucose and are all expressing high Sir3 levels (Sir3 under the control of the constitutive GPD promoter). From top to bottom: Net1-BFP2 Rap1-GFP Sir3-mCherry (yAT3901), Sik1-BFP2 Net1-GFP sir3-mCherry (yAT2213), and Sik1-BFP2 Rap1-GFP Sir3-mCherry (yAT3666). (D) Schema representing the nuclear organization of a wild type, a strain overexpressing the Sir3-A2Q separation-of-function mutant, and a strain overexpressing the wild-type Sir3. Scale bar: 1 µm in all panels.


