
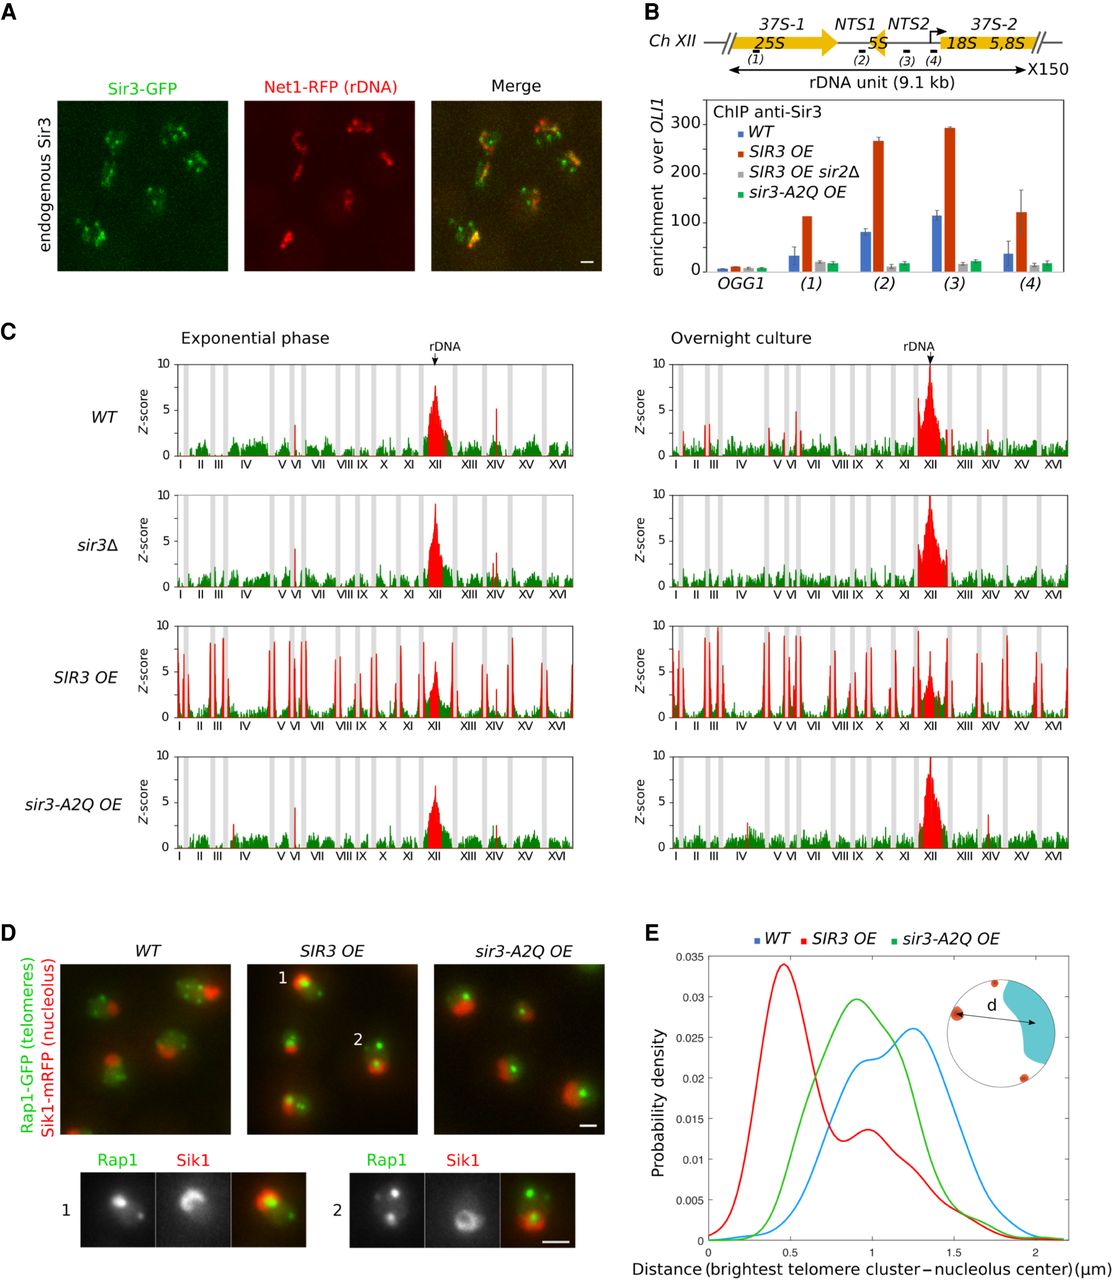
Sir3 but not the silencing-deficient mutant, Sir3-A2Q, associates with the rDNA and promotes rDNA-telomere contacts. (A) Representative fluorescent images of a double-tagged Sir3-yeGFP/Net1-TagRFP-T strain (yAT2803). Cells were grown in CSM 2% glucose and imaged in exponential phase. (B) The S. cerevisiae rDNA locus is composed of ∼150 tandem copies of a 9.1-kb repeating unit, each encoding two transcribed region RDN5 and RDNA37 (comprising RDN18, RDN5.8, and RDNA25 genes). The graph represents Sir3 occupancy along the rDNA locus probed by ChIP-qPCR using an anti-Sir3 antibody (Ruault et al. 2011) in WT (yAT232), GAL1p-SIR3 (yAT208), GAL1p-sir3-A2Q (yAT1205), and GAL1p-SIR3 sir2Δ (yAT772) strains. Primer pair 1 amplifies a region of the RDN25 locus, primer pair 2 amplifies a region in NTS1 (Non-Transcribed Spacer 1) region, primer pair 3 amplifies a region in NTS2, and primer 4 amplifies a region in the ETS1 (External Transcribed Spacer 1) region (see Supplemental Table S2 for primer sequences). Strains were grown in YPGal for 48 h. The bar graph represents the Sir3 enrichment over the mitochondrial locus OLI1. Error bars show the SEM of three independent experiments, each analyzed in triplicate qPCRs. (C) 4C extraction profiles representing contact maps between the rDNA repeats and the rest of the genome; profiles are shown for all strains in both exponential and overnight cultures. Red-highlighted loci correspond to bins with z-value greater than 2.5. (D) Representative fluorescent images of a double-tagged strain Rap1-GFP/Sik1-mRFP in strains expressing an endogenous level of Sir3 (yAT340), high levels of Sir3 (yAT341), or high levels of the separation-of-function mutant Sir3-A2Q (yAT1198) after an overnight culture in CSM 2% galactose. Magnification of representative nuclei (1 and 2) are presented at the bottom of the panel. (E) Distance between the brightest Rap1-GFP cluster and the nucleolus center is plotted for a wild type (yAT340, n = 581), a strain overexpressing Sir3 (yAT341, n = 627), and a strain overexpressing Sir3-A2Q (yAT1198, n = 590) using the NucLoc software (Berger et al. 2008). Cells were grown in CSM 2% galactose overnight before imaging. Scale bar: 1 µm in all panels.


