
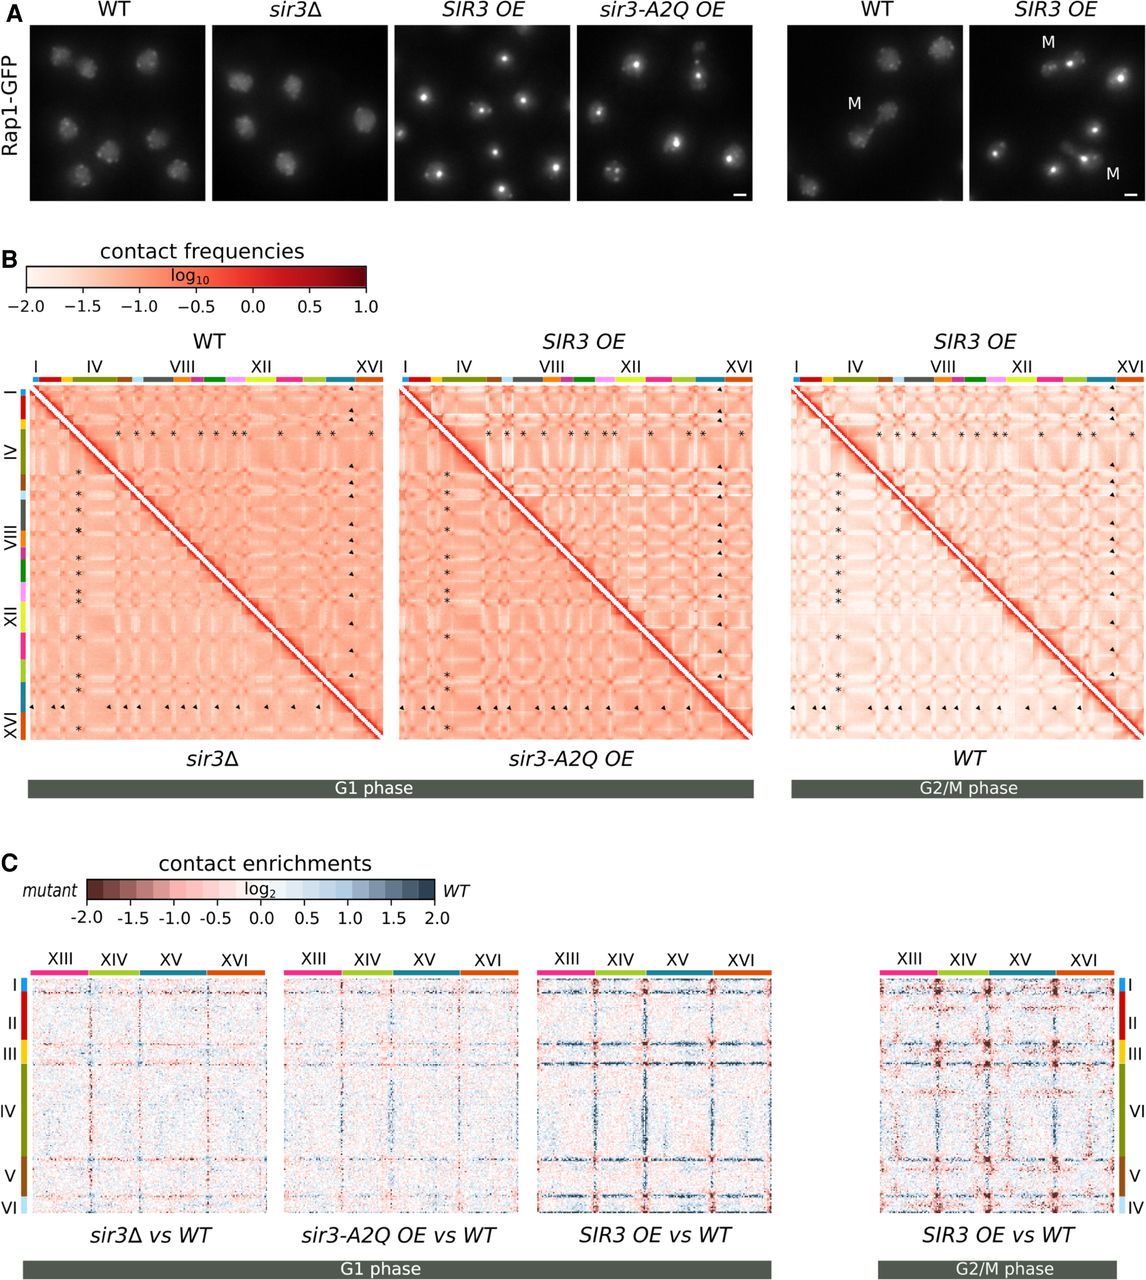
Sir3 impacts genome organization. (A) Representative fluorescent images of the telomere-associated protein Rap1 tagged with GFP in exponentially growing strains expressing different Sir3 levels: wild type (yAT2583), no Sir3 (yAT2584), high Sir3 levels (yAT2476), or high Sir3-A2Q levels (yAT2822). The two panels on the far right: representative mitotic cells (M) in the wild-type strain or in the strain overexpressing Sir3. (B) Normalized chromosome contact maps (bin: 50 kb) of cells expressing various levels of Sir3 synchronized either in G1 or G2/M. (C) Ratio plots of pairs of contact maps of four representative chromosomes. Blue: enrichment of contacts in WT; red: enrichment in mutants.


