
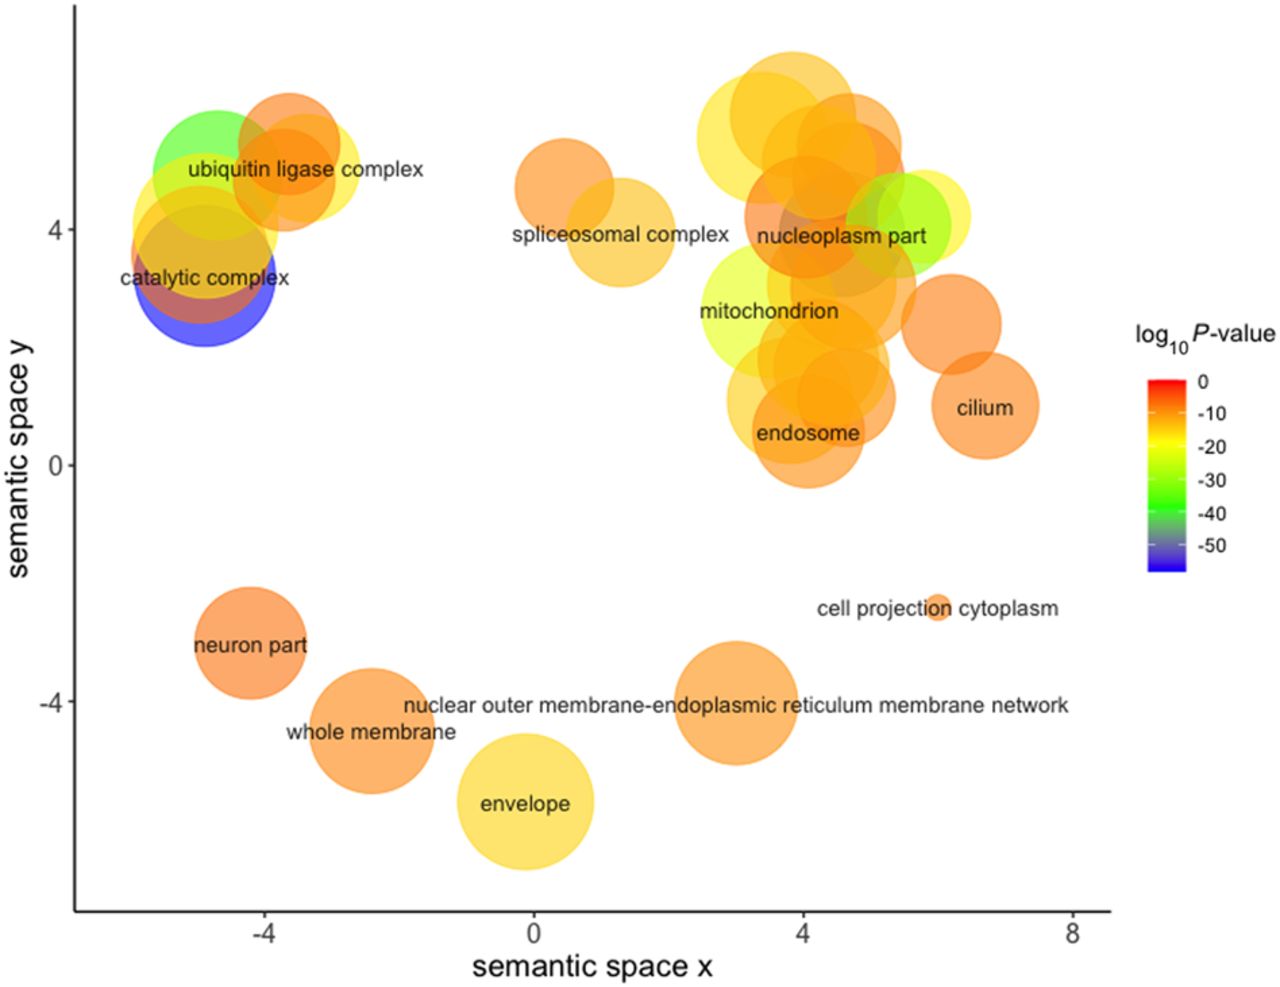
Figure 2.
REVIGO visualization of GO cellular component terms significantly associated with mtDNA-CN after removal of redundant GO terms. Size of the circle represents the relative number of genes in each gene set, color represents significance. Axes represent semantic similarities between GO terms; GO terms that are more similar will cluster with one another.


