
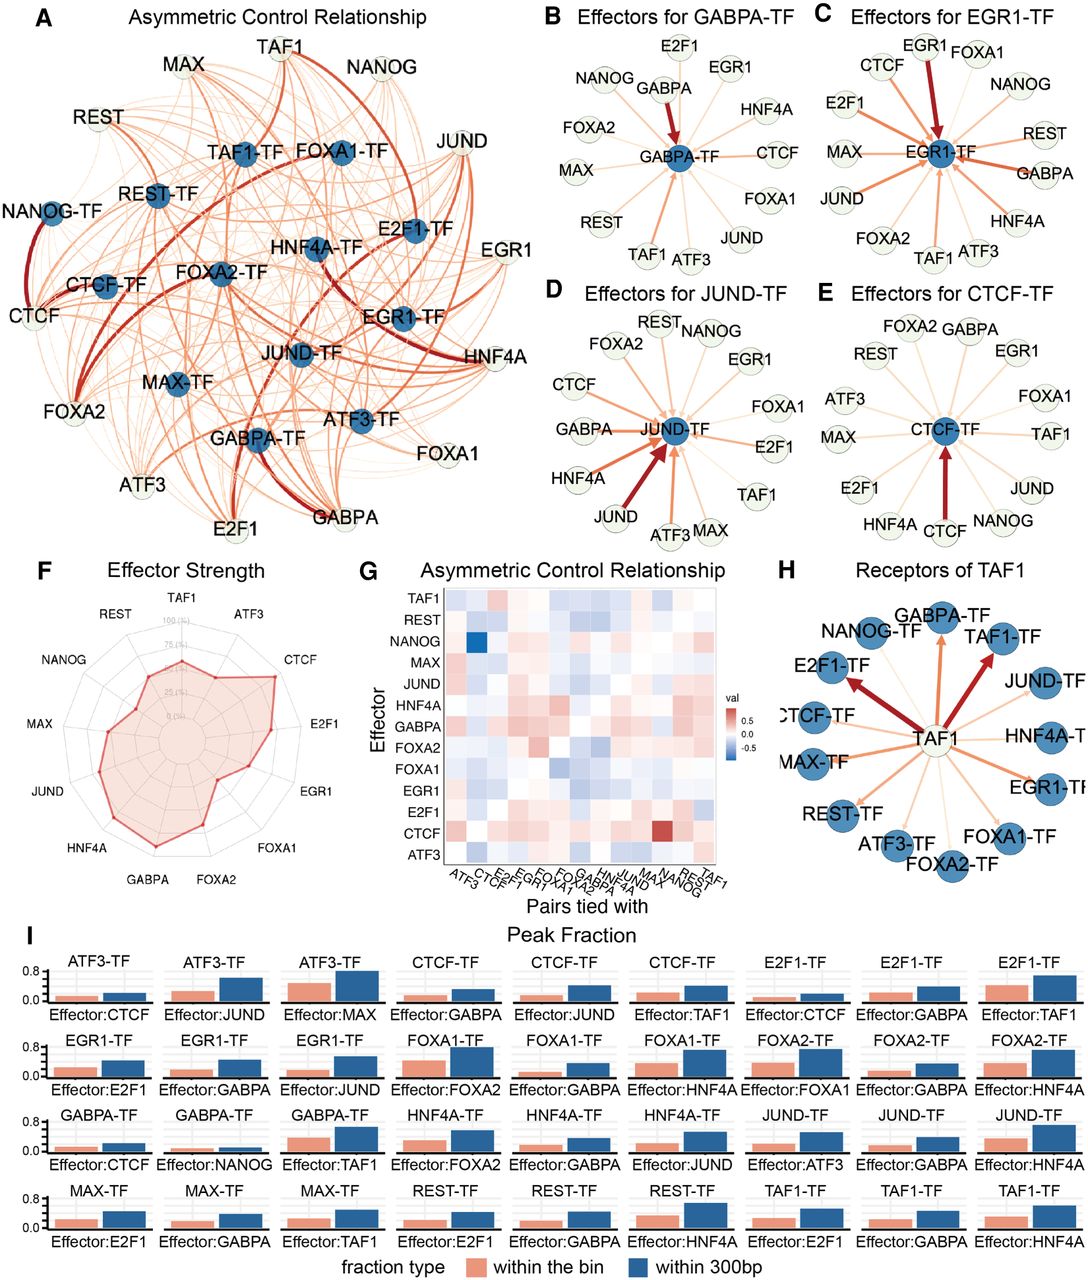
Asymmetric regulatory relationships of TF-TF pairs in controlling cobinding. (A) In this network, each node represents a TF or a TF-TF pair. Each edge that connects a TF and a pair represents the contribution of that TF to the pair when predicting cobinding events. The width and color of an edge represent the strength of the contribution. (B–E) Directed regulatory networks of TF-TF pairs effectors. In each network, the blue node represents a TF-TF pair and the light color node represents a TF motif signature. The arrow direction represents the contribution of a TF to a TF-TF pair. The width and color of an edge represent the strength of the contribution. In B, GABPA, TAF1, and CTCF are the three most effective effectors for pairs tied with GABPA. In C, JUND, TAF1, and EGR1 are the most effective effectors for pairs tied with EGR1. In D, JUND is the most dominant effector for pairs tied with JUND. In E, CTCF is the most dominant effector for pairs tied with CTCF. The four examples show that the contribution of different TF effectors and both pair-relative and pair-irrelative TFs affect cobinding. (F) Radar plot of effectors strength averaging over pairs. Among the 13 TFs, CTCF, JUND, and TAF1 are the three most contributive effectors compared with other TFs. (G) Asymmetric control heat map. Each cell represents the difference between (1) the contribution of TF1 to pairs tied with TF2 and (2) the contribution of TF2 to pairs tied with TF1. Positive and negative values are shown in red and blue, respectively. (H) Contribution of TAF1 is different when predicting the cobinding of pairs tied with different TFs. (I) Peak fractions of TF-specific effectors binding with TF pairs. Red bars: the fraction of the effector binding in the bins under investigation; blue bars: the fraction of the effector binding within 300 bp of the bins under investigation.


