
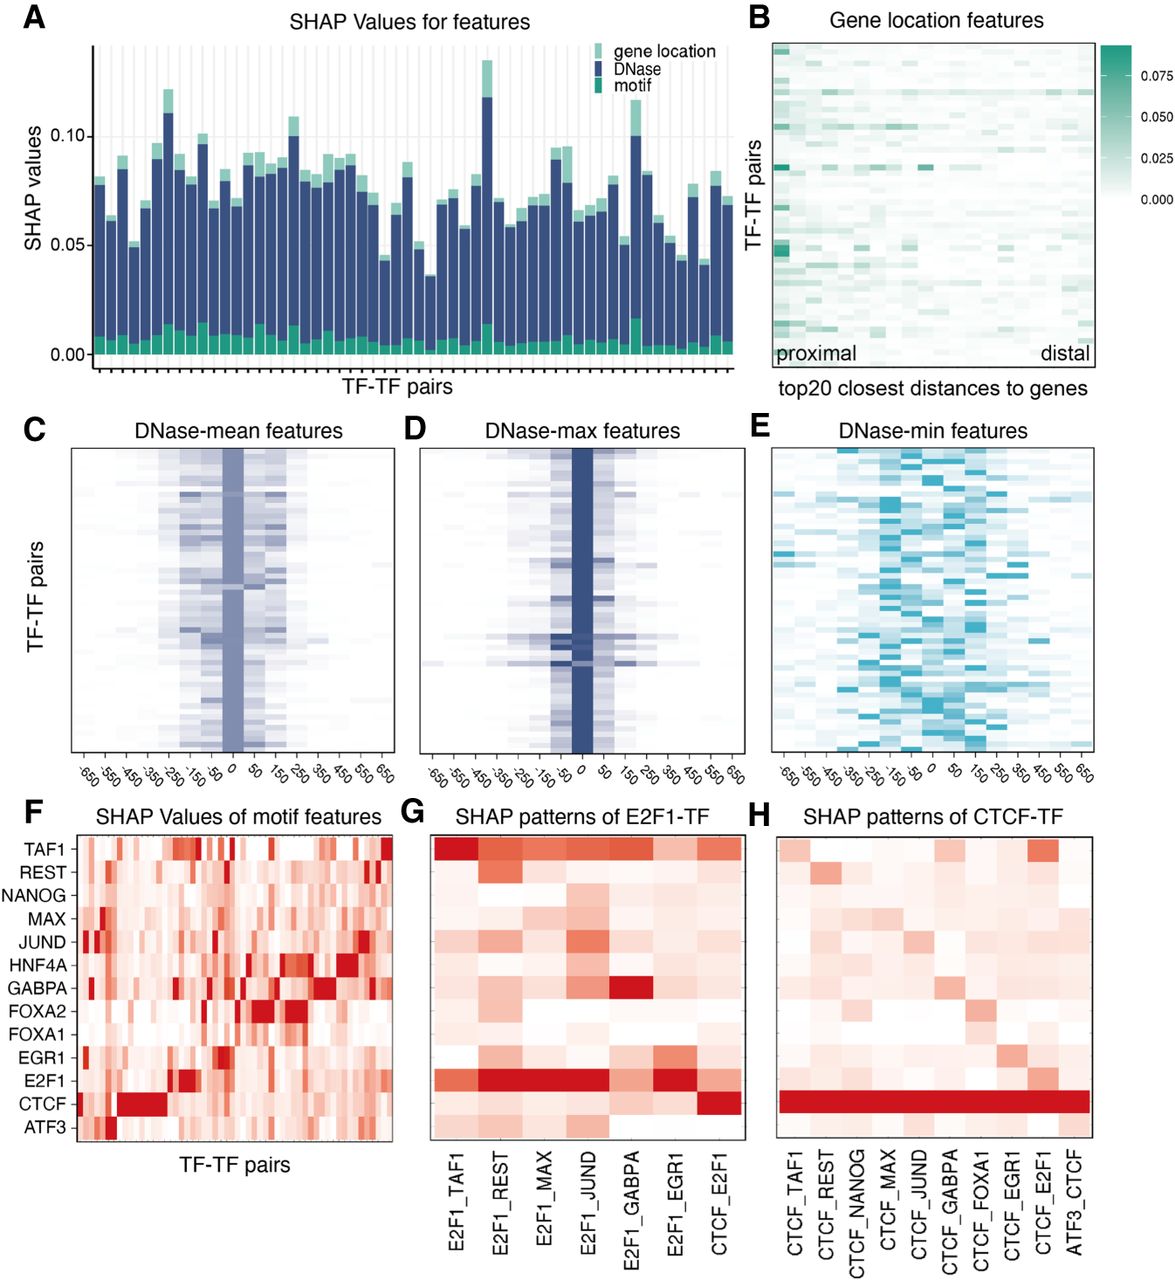
Game theoretical approach–based analysis of determinants of TF cobinding. (A) SHAP values of DNase-seq-based features (blue), TF motif–based features (dark green), and distance-to-gene features (light green). DNase-seq-based features play the most important role in all TF-TF pairs. (B) The spatial distribution of distance-to-gene features. Columns correspond to the top 20 closest distances to proximal genes and rows are the 56 TF-TF pairs. Distances to proximal genes are more important than those to distal genes. (C–E) Spatial distributions of DNase-seq-based features. In the heat map, each row corresponds to a TF-TF pair and each column corresponds to one 200-bp genomic interval. Zero represents the feature calculated from the target interval, and ± represents the upstream/downstream neighboring intervals. (F) The spatial distribution of TF motif–based features. Each column is a TF-TF pair and each row is the motif-based features averaging at one TF. The motifs-based features for TFs that are the component of the TF-TF pair have higher contributions. In addition to the component TF, other TF sequences are also predictive. (G) The SHAP value pattern of TF pairs tied with E2F1. For most pairs, E2F1 motif–based features have the highest SHAP values. For E2F1-TAF1, both E2F1 and TAF1 have higher SHAP values than other TFs. (H) The SHAP value pattern of pairs tied with CTCF. For most pairs, CTCF motif–based features have the highest SHAP values. Other TF motifs like NANOG and TAF1 also play an important role.


