
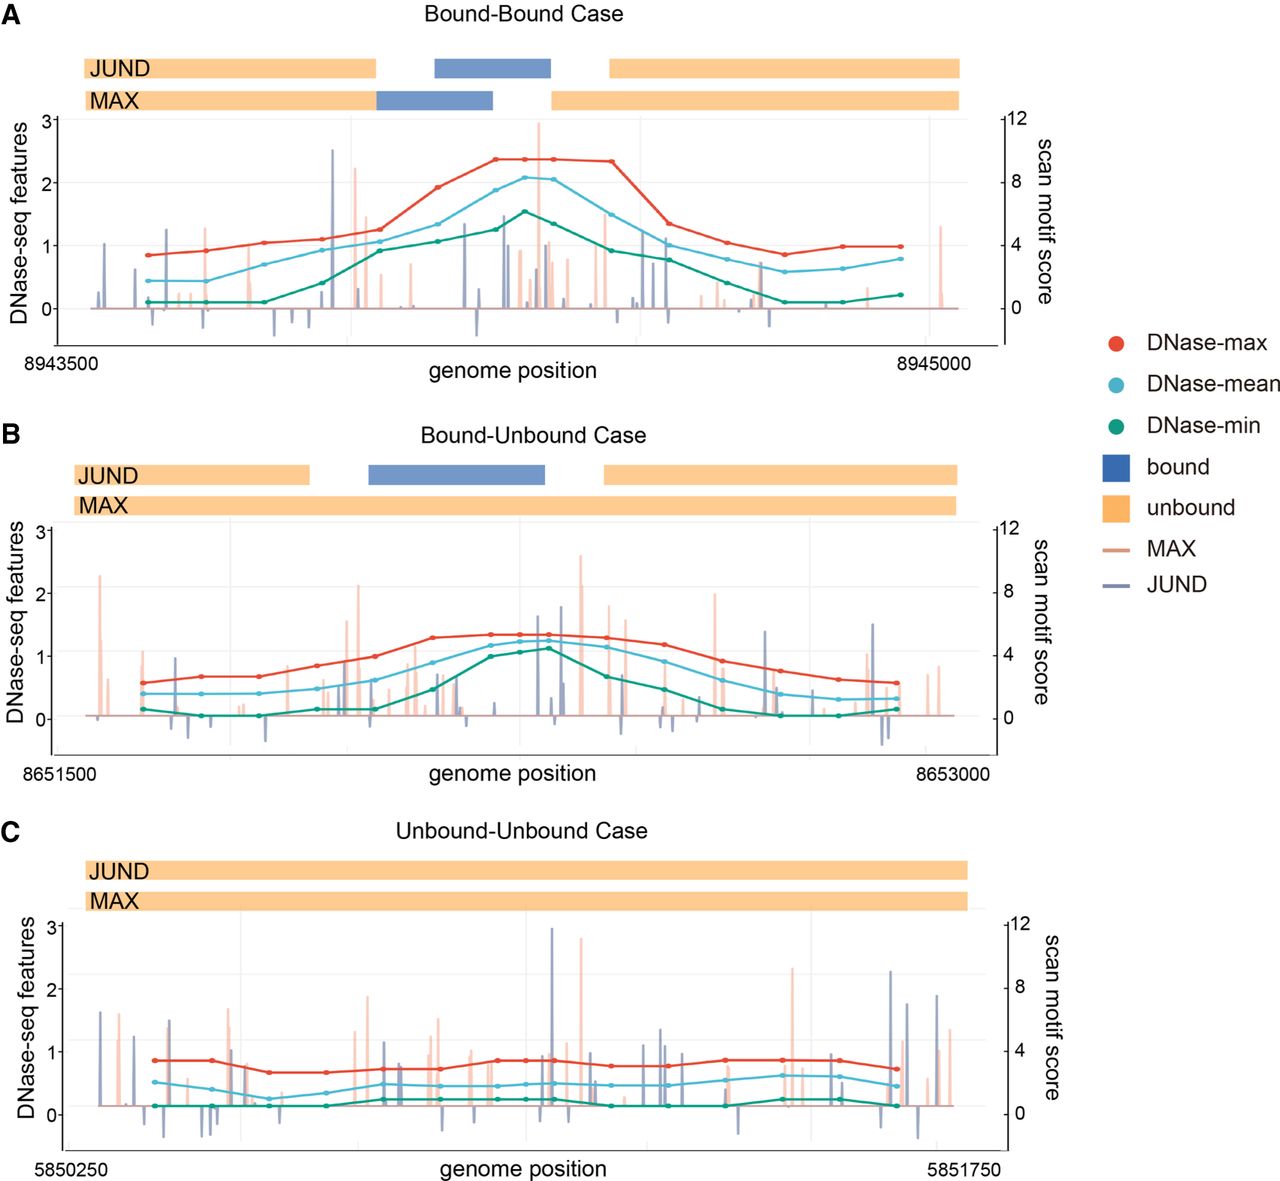
Examples of predicting TF-TF cobinding and un-cobinding events. The comparison of TF binding signals from ChIP-seq (the blue/orange horizontal bar on the top), DNase-seq-based features (the red/blue/green scatter points and lines in the middle), and TF motif hits (the blue/orange vertical bars on the bottom). (A) A cobound (Bound-Bound) case of the JUND-MAX pair in Chromosome 2 between position 8944200 and 8944400 in K562. The red, blue, and green dots represent the maximum, mean, and minimum DNase-seq values, respectively, in a 200-bp interval. The two bars on the top highlight the binding locations MAX and JUND. Our prediction for this interval is ‘cobound’ (0.9938). (B) An un-cobound (Bound-Unbound) case in Chromosome 2 between position 8652400 and 8652600. Specifically, JUND is bound while MAX is unbound in this interval. The prediction for this interval is ‘un-cobound’ (0.8174). (C) An un-cobound (Unbound-Unbound) case in Chromosome 2 between 5850900 and 5851100. Both JUND and MAX are unbound. The prediction for this interval is ‘un-cobound’ (0.1851).


