
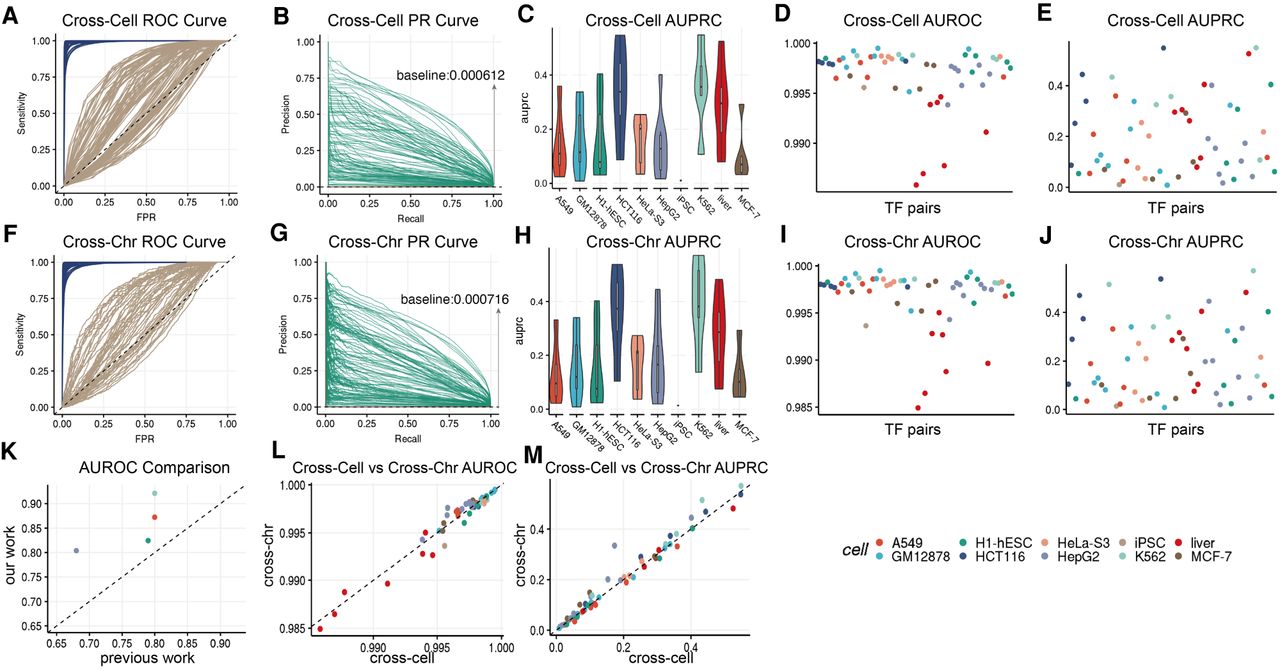
Cross-cell type and cross-chromosome evaluation of TF cobinding predictions. (A) The ROC curves of predicting cross-cell type TF cobinding. The brown lines are ROC curves of the logistic regression model. (B) The PR curves of predicting cross-cell type TF cobinding. The brown lines are PR curves of the logistic regression model. The dashed line with AUPRC of 0.000612 is the average AUPRC of the logistic regression. (C) The AUPRCs of cross-cell type predictions of 56 TF-TF pairs in 10 cell types. (D,E) The cross-cell type AUROCs and AUPRCs of 56 TF-TF pairs. Different colors indicate different cell types. All cell lines represented in the figure are testing cell lines. (F–J) Represent cross-chromosome evaluations. (K) AUROC comparison of our method (y-axis) and a previous work (x-axis) (Liu et al. 2016). The cross-cell type predictions of ATF3-CTCF on cell lines A549, H1-hECS, HepG2, and K562 are compared. (L) The AUROC and (M) the AUPRC comparison of cross-cell type (x-axis) and cross-chromosome (y-axis) predictions.


