
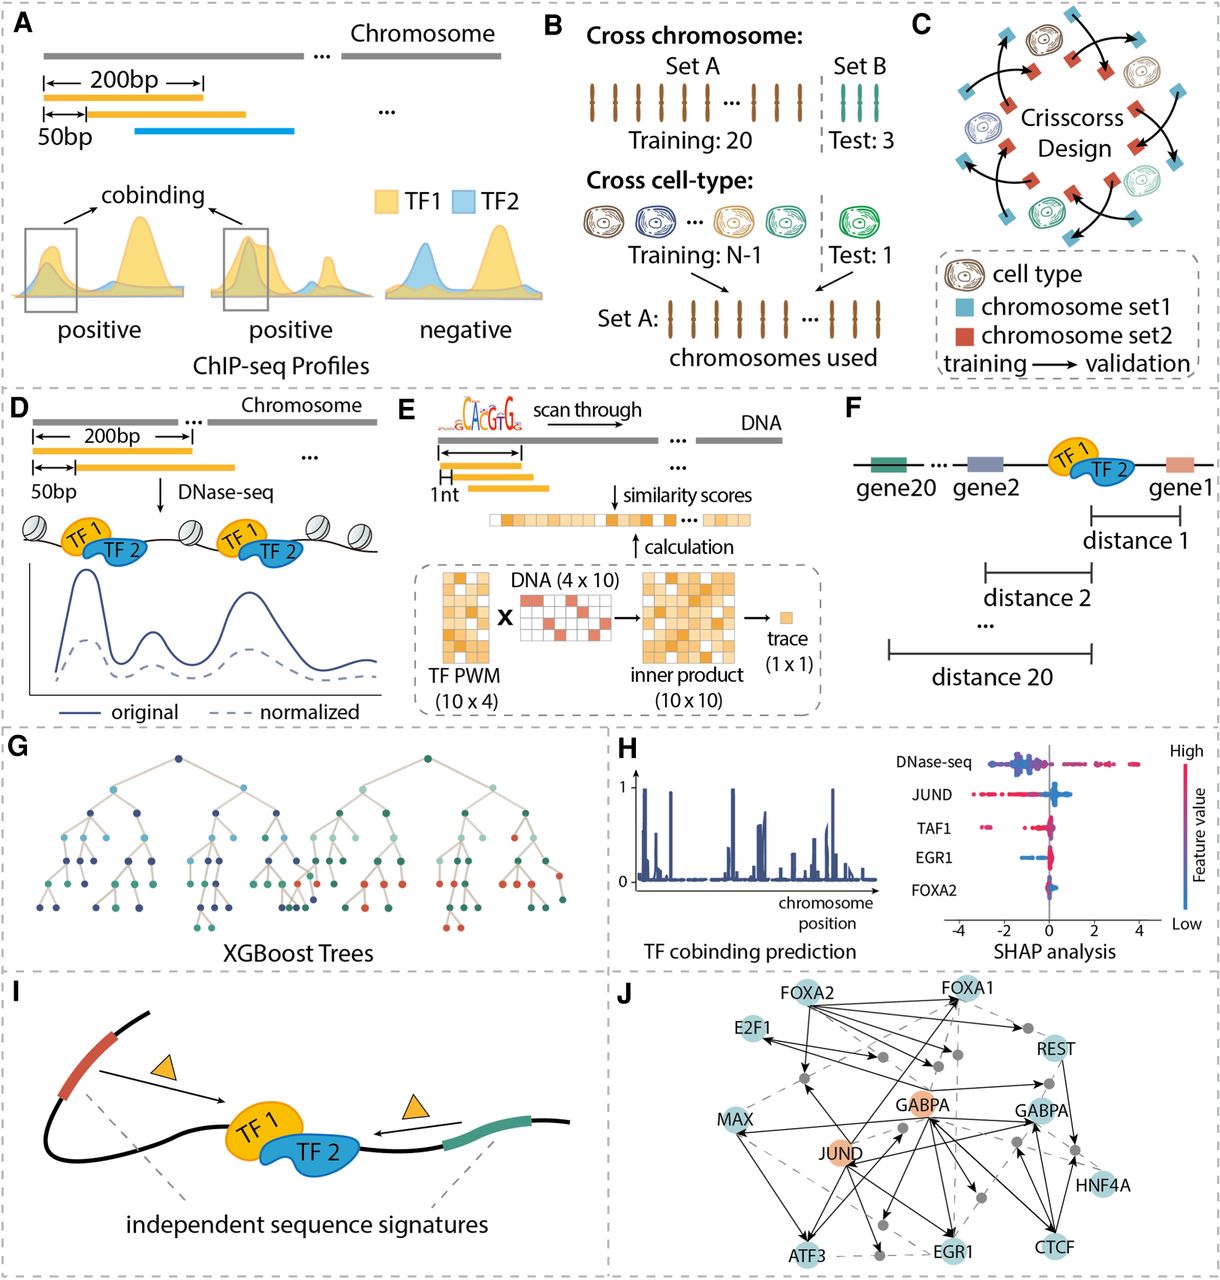
Machine learning–based method for identifying independent sequence signatures for TF binding and cobinding. (A) Preparing gold standard co-occupancy profiles from the ChIP-seq data of single TF binding profiles. For each 200-bp genomic interval of interest, it was labeled as ‘cobound’ if the labels of both TFs at this interval were ‘bound.’ (B) Train-test data partition for cross-chromosome and cross-cell type cases. (C) Crisscross design of model training and validating. Chromosomes were split into two sets. The blue and red squares represent the chromosome set 1 and set 2, respectively. The starting point of the arrow represents the training data set, and the endpoint of the arrow represents the validation data set. (D) DNase-seq-based features. Quantile normalization was applied to the original reads to eliminate experimental biases. In the plot, the dashed line is the values after quantile normalization and the solid line is the original reads. (E) DNA sequence and motif-based features. (F) Distance-to-gene features. Top 20 closest distances to proximal genes are calculated according to GENCODE annotation. (G) Illustration of tree-based machine learning models. (H) Predictions are continuous values between 0 and 1, which were generated by averaging results from all built models, and SHAP analysis (figure is illustrative only) was used to calculate feature importance in predicting TF cobinding. (I) Independent sequence signatures affect TF cobinding. (J) Illustration of TF cobinding effector network. Dashed lines connect TF pairs, and solid arrows connect TF-specific effectors with TF- or TF pair–specific effectors with TF pairs.


