
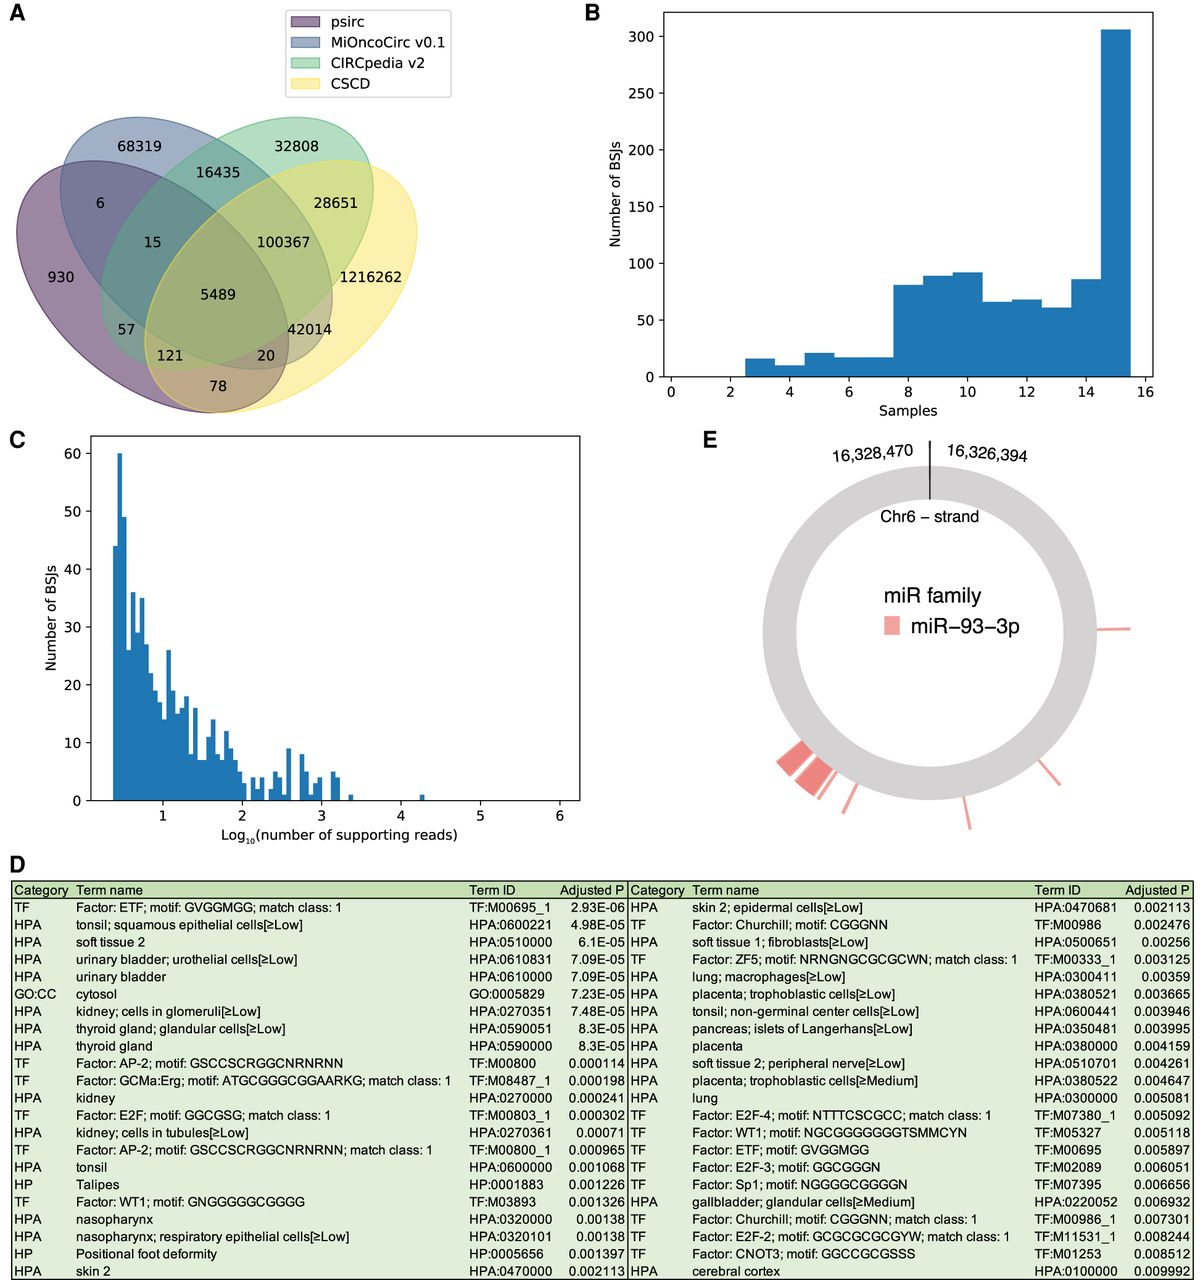
Figure 6.
Analyses of the results produced by psirc from the NPC and NP samples. (A) A Venn diagram comparing the frequently expressed BSJs identified from the NPC and NP samples with those in three circRNA databases. (B,C) Histograms of the frequently expressed novel BSJs not contained by any of the three databases, in terms of the number of NPC and NP samples from which they were called (B) and their average number of supporting reads among the samples from which they were called (C). (D) Enriched functional terms (adjusted P < 0.01) of the down-regulated genes based on the full-length circRNA isoform analysis. (E) MREs on the differentially expressed ATXN1 circRNA.


