
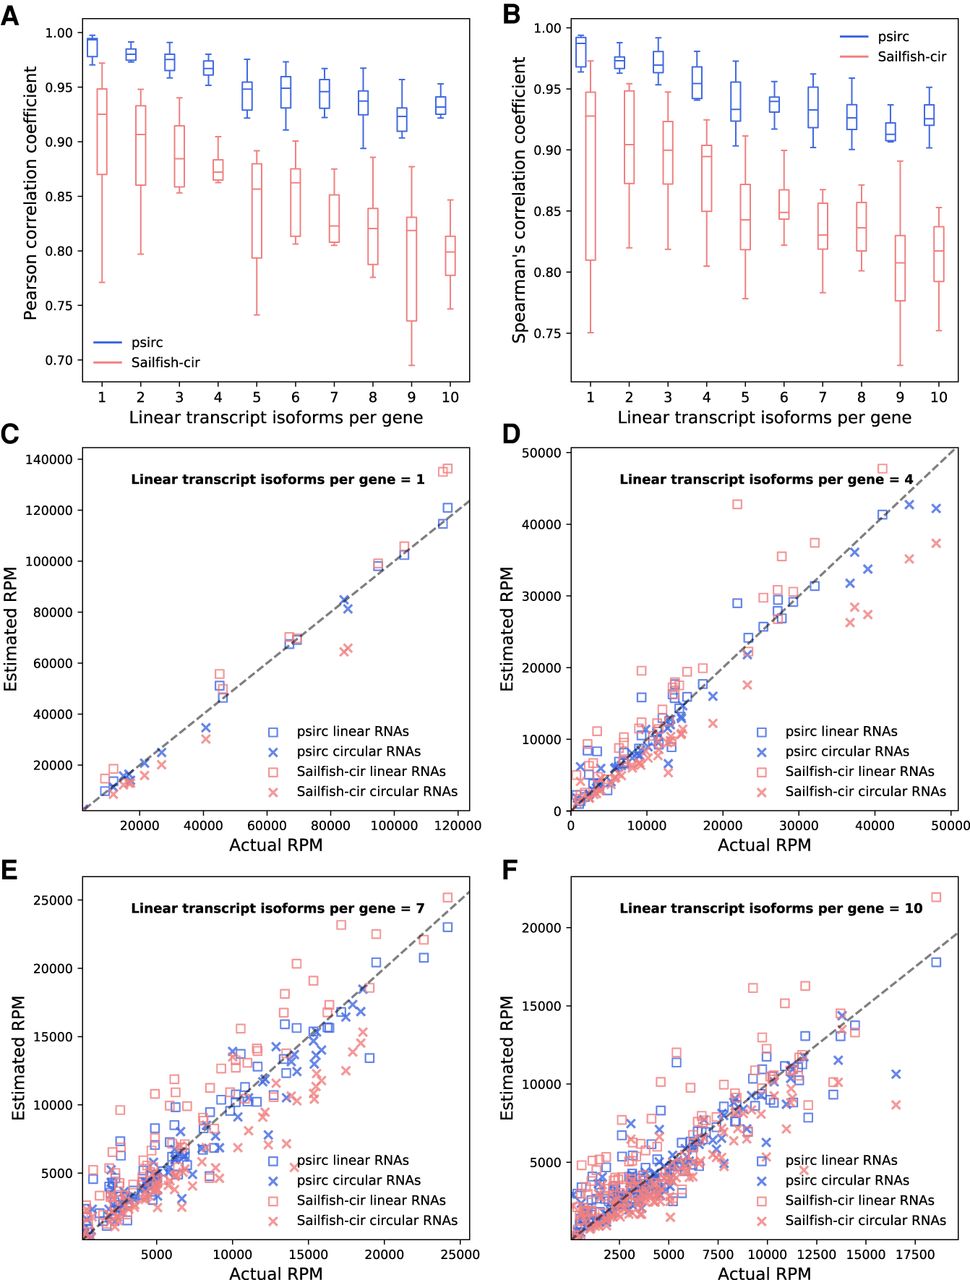
Quantification performance of psirc and Sailfish-cir on the second simulated data set. Pearson (A) and Spearman's (B) correlation coefficients were computed between the estimated and actual expression levels. Each box plot shows the distribution of correlations from the 10 sets of random transcripts, with each correlation coefficient computed based on all the transcripts from the 10 genes in that set. (C–F) The estimated and actual read counts per million reads aligned are shown for each transcript isoform for the gene that Sailfish-cir achieved the strongest Pearson correlation in each group, when each gene had one (C), four (D), seven (E), or 10 (F) linear isoforms per gene.


