
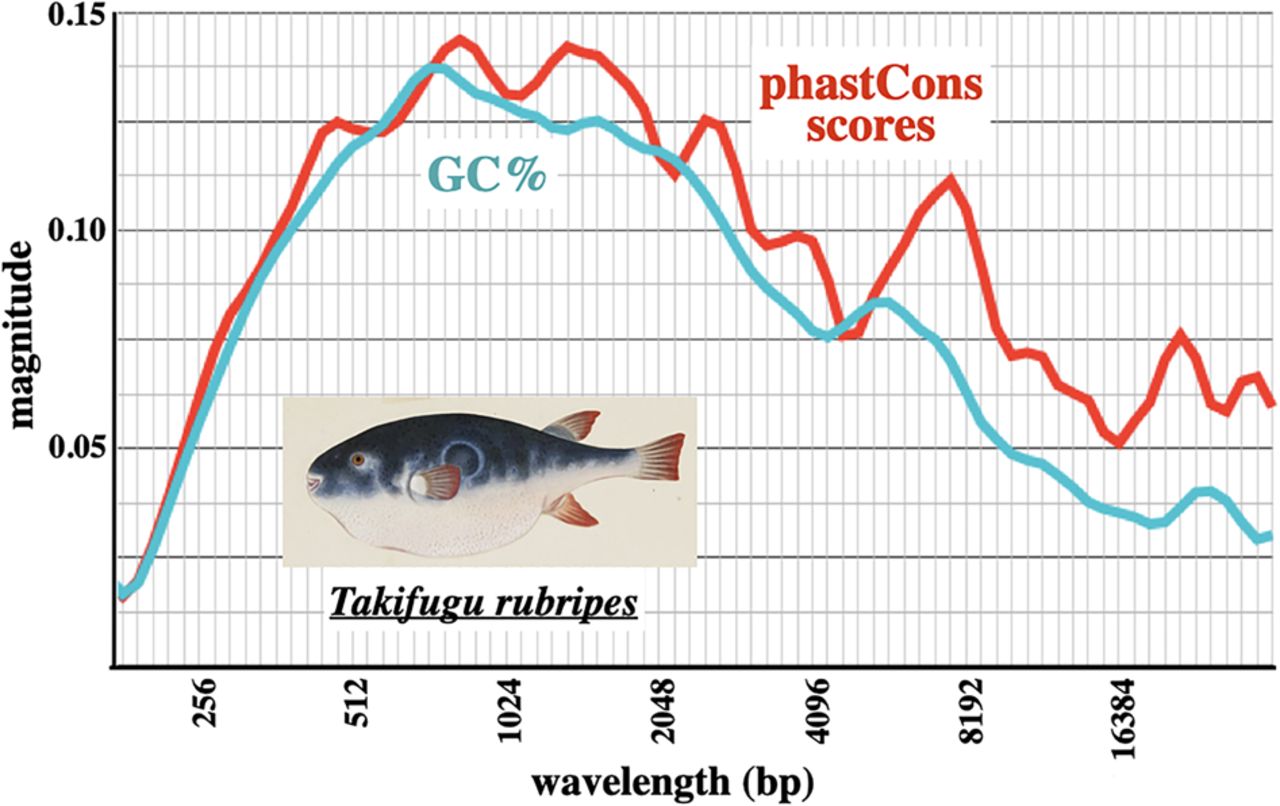
Figure 8.
Pufferfish oscillation in GC% and in conservation. Six exon-poor segments of the Takifugu rubripes Chromosome 1, combined with the HOX Aa, Ba, and C loci (∼1.27 Mb in total) were analyzed as in Figure 6. The fish shows broad peaks of oscillation magnitude in GC% and conservation. The pufferfish picture (courtesy of Naturalis Biodiversity Center/Wikimedia Commons) is an early 1800s work by Kawahara Keiga.


